Last active
October 31, 2026 15:53
-
-
Save Hermann-SW/f57fd554375284723a968984b62131b6 to your computer and use it in GitHub Desktop.
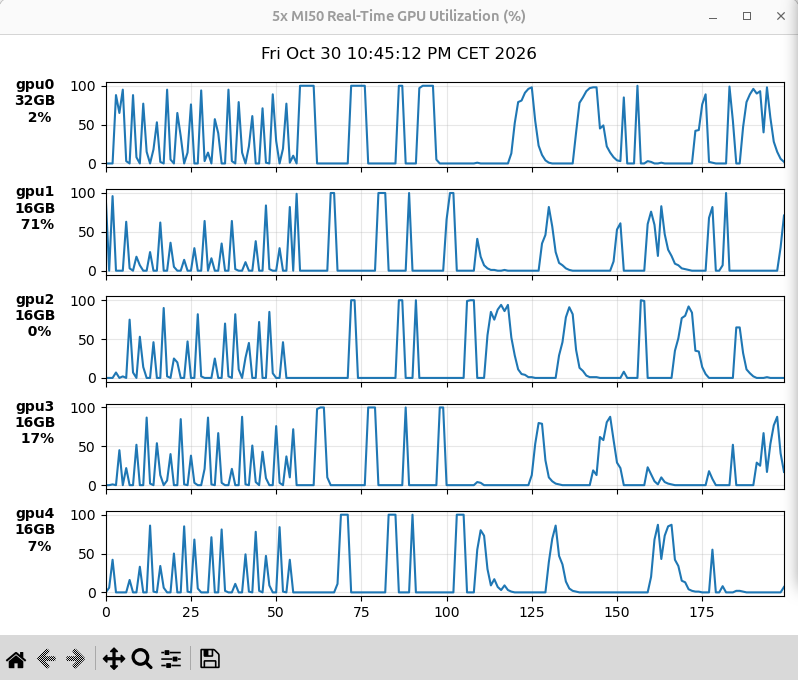
multiple Instinct MI50 real time GPU% graphing
This file contains hidden or bidirectional Unicode text that may be interpreted or compiled differently than what appears below. To review, open the file in an editor that reveals hidden Unicode characters.
Learn more about bidirectional Unicode characters
| #!/usr/bin/env python3 | |
| """ multiple Instinct MI50 real time GPU% graphing """ | |
| import glob | |
| import os | |
| import time | |
| from collections import deque | |
| import matplotlib.pyplot as plt | |
| from matplotlib import animation | |
| def is_amd_vega20(ddir): | |
| """ Filter specifically for AMD Vega 20 GPUs (0x66a0-4,7,f) """ | |
| with open(os.path.join(ddir, "device"), encoding="utf-8") as f: | |
| if 0x809f>>(int(f.read().strip(), 16)^0x66a0)&1: | |
| with open(os.path.join(ddir, "vendor"), encoding="utf-8") as v: | |
| return v.read().strip() == "0x1002" | |
| return False | |
| paths = [] | |
| names = [] | |
| for dev_dir in sorted(glob.glob("/sys/class/drm/card*/device")): | |
| try: | |
| if is_amd_vega20(dev_dir): | |
| busy_path = os.path.join(dev_dir, "gpu_busy_percent") | |
| vram_path = os.path.join(dev_dir, "mem_info_vram_total") | |
| if os.path.exists(busy_path) and os.path.exists(vram_path): | |
| with open(vram_path, encoding="utf-8") as vf: | |
| vram_gb = (int(vf.read().strip()) + (1 << 29)) >> 30 | |
| paths.append(busy_path) | |
| names.append(f"{dev_dir.split('/')[4].replace("card", "gpu")}\n{vram_gb}GB") | |
| except OSError: | |
| continue | |
| HISTORY = 200 | |
| TIME_FMT = "%a %b %d %I:%M:%S %p %Z %Y" | |
| data = [deque([0] * HISTORY, maxlen=HISTORY) for _ in paths] | |
| fig, axes = plt.subplots(len(paths), 1, sharex=True, figsize=(8, 6)) | |
| if len(paths) == 1: | |
| axes = [axes] | |
| fig.canvas.manager.set_window_title( | |
| str(len(paths)) + "x MI50 Real-Time GPU Utilization (%)" | |
| ) | |
| suptitle = fig.suptitle(time.strftime(TIME_FMT)) | |
| lines = [] | |
| for ax, name in zip(axes, names): | |
| line, = ax.plot(range(HISTORY), data[0], lw=1.5) | |
| ax.set_ylim(-5, 105) | |
| ax.set_xlim(0, HISTORY - 1) | |
| ax.set_ylabel(name, rotation=0, labelpad=25, fontweight="bold") | |
| ax.grid(True, alpha=0.3) | |
| lines.append(line) | |
| def update(_): | |
| """ Read sysfs GPU utilization and update subplot lines and timestamp """ | |
| suptitle.set_text(time.strftime(TIME_FMT)) | |
| for i, p in enumerate(paths): | |
| with open(p, "r", encoding="utf-8") as f2: | |
| val = int(f2.read().strip()) | |
| data[i].append(val) | |
| lines[i].set_ydata(data[i]) | |
| axes[i].set_ylabel(f"{names[i]}\n{val:3d}%", rotation=0, labelpad=25) | |
| return lines | |
| ani = animation.FuncAnimation( | |
| fig, update, interval=200, blit=False, cache_frame_data=False | |
| ) | |
| plt.tight_layout() | |
| plt.show() |

Author
Sign up for free
to join this conversation on GitHub.
Already have an account?
Sign in to comment
Start with:
During 78B Kolibri-1 model Open WebUI llama.cpp response processing: