This UserScript injects the Eruda developer console into any website, providing powerful debugging tools for mobile browsers.
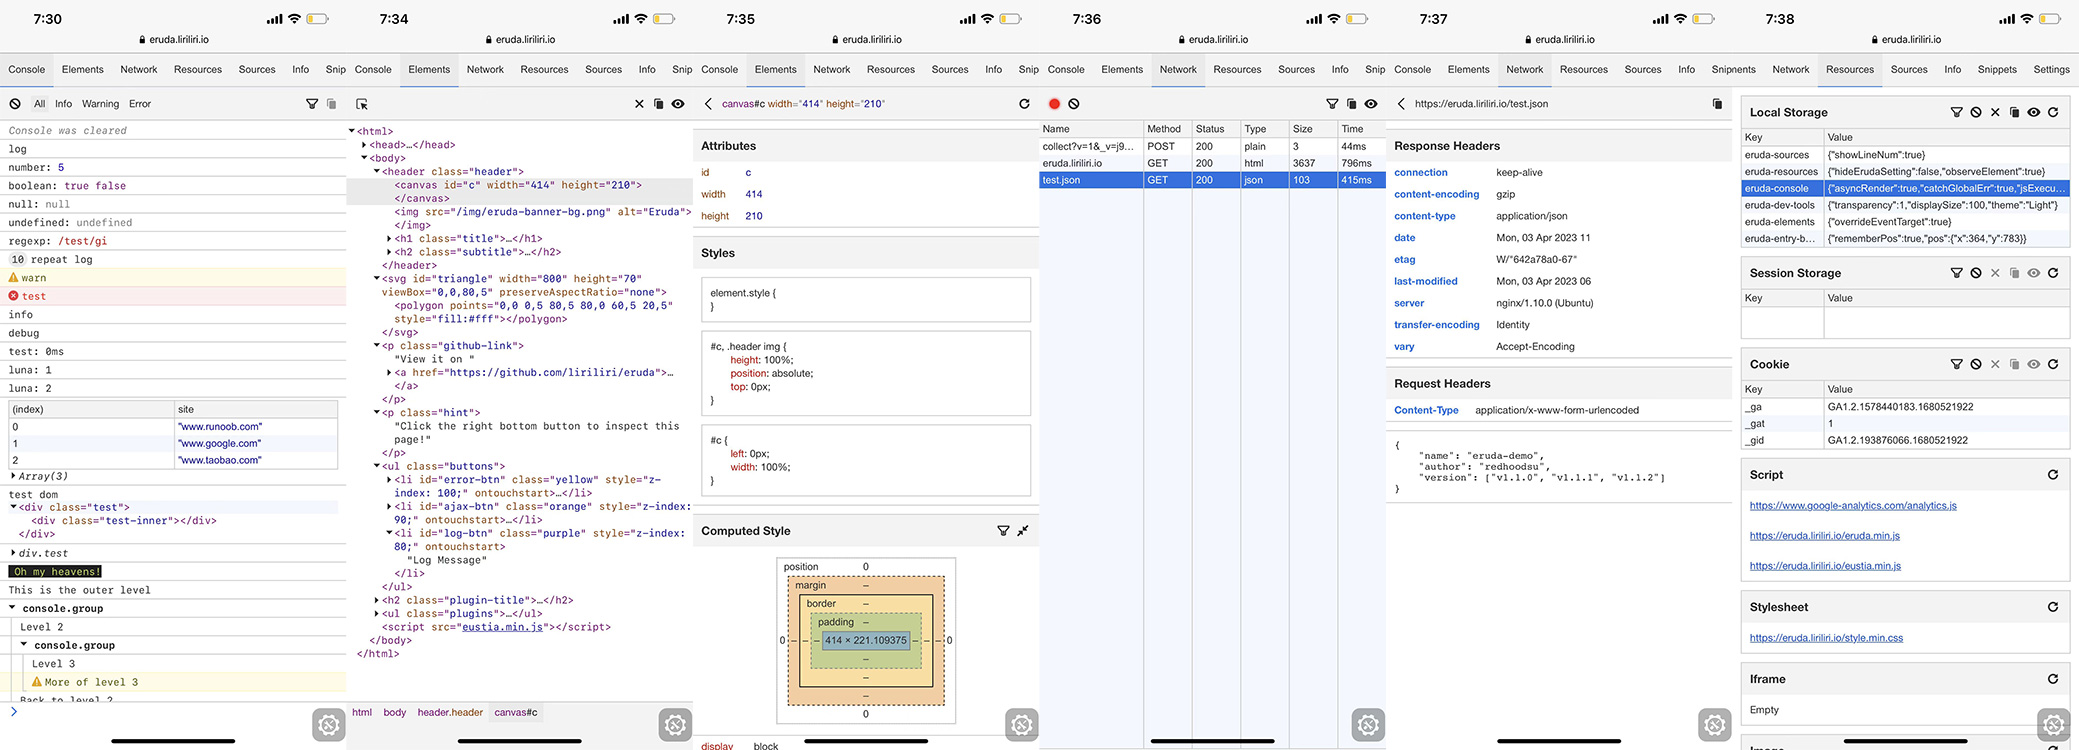
- Console: Display JavaScript logs.
- Elements: Check dom state.
- Network: Show requests status.
- Resources: Show localStorage, cookie information.
- Info: Show url, user agent info.
- Snippets: Include snippets used most often.
- Sources: Html, js, css source viewer.
- Plugins: Extend functionality with various plugins 👇
- eruda-monitor: Display page fps and memory.
- eruda-features: Browser feature detections.
- eruda-timing: Show performance and resource timing.
- eruda-code: Run JavaScript code.
- eruda-benchmark: Run JavaScript benchmarks.
- eruda-geolocation: Test geolocation.
- eruda-orientation: Test orientation api.
- eruda-touches: Visualize screen touches.
- eruda-vue: Vue devtools.
- 😲 And more: If you want to create a plugin yourself, follow the guides here.
- Install Tampermonkey or another userscript manager
- Click here to install the script
- The Eruda console will be available on any website
- After installation, a small Eruda icon will appear in the corner of the page
- Drag the icon to reposition it on the screen
- Click the icon to open the developer tools
- Use the tabs at the bottom to switch between different tools
- Click the icon to close the developer tools
For more detailed information and advanced usage, please refer to the official Eruda documentation.
Read Contributing Guide for development setup instructions. Oficial repo: https://github.com/liriliri/eruda.
This project is licensed under the MIT License - see the LICENSE file for details.
- Runzi Su - Creator of Eruda console for mobile browsers
- Jesús Lautaro Careglio Albornoz - Maintainer of the Tampermonkey userscript