Created
October 8, 2012 15:06
-
-
Save nachocab/3853004 to your computer and use it in GitHub Desktop.
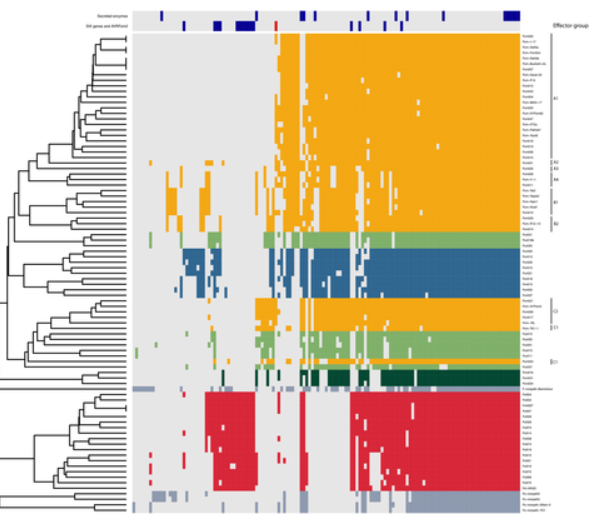
heatmap 3 revised
This file contains hidden or bidirectional Unicode text that may be interpreted or compiled differently than what appears below. To review, open the file in an editor that reveals hidden Unicode characters.
Learn more about bidirectional Unicode characters
| # EXAMPLE USAGE | |
| # example of colsidecolors rowsidecolors (single column, single row) | |
| mat <- matrix(1:100, byrow=T, nrow=10) | |
| column_annotation <- sample(c("red", "blue", "green"), 10, replace=T) | |
| column_annotation <- as.matrix(column_annotation) | |
| colnames(column_annotation) <- c("Variable X") | |
| row_annotation <- sample(c("red", "blue", "green"), 10, replace=T) | |
| row_annotation <- as.matrix(t(row_annotation)) | |
| rownames(row_annotation) <- c("Variable Y") | |
| heatmap.3(mat, RowSideColors=row_annotation, ColSideColors=column_annotation) | |
| # multiple column and row | |
| mat <- matrix(1:100, byrow=T, nrow=10) | |
| column_annotation <- matrix(sample(c("red", "blue", "green"), 20, replace=T), ncol=2) | |
| colnames(column_annotation) <- c("Variable X1", "Variable X2") | |
| row_annotation <- matrix(sample(c("red", "blue", "green"), 20, replace=T), nrow=2) | |
| rownames(row_annotation) <- c("Variable Y1", "Variable Y2") | |
| heatmap.3(mat, RowSideColors=row_annotation, ColSideColors=column_annotation) | |
| # CODE | |
| heatmap.3 <- function(x, | |
| Rowv = TRUE, Colv = if (symm) "Rowv" else TRUE, | |
| distfun = dist, | |
| hclustfun = hclust, | |
| dendrogram = c("both","row", "column", "none"), | |
| symm = FALSE, | |
| scale = c("none","row", "column"), | |
| na.rm = TRUE, | |
| revC = identical(Colv,"Rowv"), | |
| add.expr, | |
| breaks, | |
| symbreaks = max(x < 0, na.rm = TRUE) || scale != "none", | |
| col = "heat.colors", | |
| colsep, | |
| rowsep, | |
| sepcolor = "white", | |
| sepwidth = c(0.05, 0.05), | |
| cellnote, | |
| notecex = 1, | |
| notecol = "cyan", | |
| na.color = par("bg"), | |
| trace = c("none", "column","row", "both"), | |
| tracecol = "cyan", | |
| hline = median(breaks), | |
| vline = median(breaks), | |
| linecol = tracecol, | |
| margins = c(5,5), | |
| ColSideColors, | |
| RowSideColors, | |
| side.height.fraction=0.3, | |
| cexRow = 0.2 + 1/log10(nr), | |
| cexCol = 0.2 + 1/log10(nc), | |
| labRow = NULL, | |
| labCol = NULL, | |
| key = TRUE, | |
| keysize = 1.5, | |
| density.info = c("none", "histogram", "density"), | |
| denscol = tracecol, | |
| symkey = max(x < 0, na.rm = TRUE) || symbreaks, | |
| densadj = 0.25, | |
| main = NULL, | |
| xlab = NULL, | |
| ylab = NULL, | |
| lmat = NULL, | |
| lhei = NULL, | |
| lwid = NULL, | |
| NumColSideColors = 1, | |
| NumRowSideColors = 1, | |
| KeyValueName="Value",...){ | |
| invalid <- function (x) { | |
| if (missing(x) || is.null(x) || length(x) == 0) | |
| return(TRUE) | |
| if (is.list(x)) | |
| return(all(sapply(x, invalid))) | |
| else if (is.vector(x)) | |
| return(all(is.na(x))) | |
| else return(FALSE) | |
| } | |
| x <- as.matrix(x) | |
| scale01 <- function(x, low = min(x), high = max(x)) { | |
| x <- (x - low)/(high - low) | |
| x | |
| } | |
| retval <- list() | |
| scale <- if (symm && missing(scale)) | |
| "none" | |
| else match.arg(scale) | |
| dendrogram <- match.arg(dendrogram) | |
| trace <- match.arg(trace) | |
| density.info <- match.arg(density.info) | |
| if (length(col) == 1 && is.character(col)) | |
| col <- get(col, mode = "function") | |
| if (!missing(breaks) && (scale != "none")) | |
| warning("Using scale=\"row\" or scale=\"column\" when breaks are", | |
| "specified can produce unpredictable results.", "Please consider using only one or the other.") | |
| if (is.null(Rowv) || is.na(Rowv)) | |
| Rowv <- FALSE | |
| if (is.null(Colv) || is.na(Colv)) | |
| Colv <- FALSE | |
| else if (Colv == "Rowv" && !isTRUE(Rowv)) | |
| Colv <- FALSE | |
| if (length(di <- dim(x)) != 2 || !is.numeric(x)) | |
| stop("`x' must be a numeric matrix") | |
| nr <- di[1] | |
| nc <- di[2] | |
| if (nr <= 1 || nc <= 1) | |
| stop("`x' must have at least 2 rows and 2 columns") | |
| if (!is.numeric(margins) || length(margins) != 2) | |
| stop("`margins' must be a numeric vector of length 2") | |
| if (missing(cellnote)) | |
| cellnote <- matrix("", ncol = ncol(x), nrow = nrow(x)) | |
| if (!inherits(Rowv, "dendrogram")) { | |
| if (((!isTRUE(Rowv)) || (is.null(Rowv))) && (dendrogram %in% | |
| c("both", "row"))) { | |
| if (is.logical(Colv) && (Colv)) | |
| dendrogram <- "column" | |
| else dedrogram <- "none" | |
| warning("Discrepancy: Rowv is FALSE, while dendrogram is `", | |
| dendrogram, "'. Omitting row dendogram.") | |
| } | |
| } | |
| if (!inherits(Colv, "dendrogram")) { | |
| if (((!isTRUE(Colv)) || (is.null(Colv))) && (dendrogram %in% | |
| c("both", "column"))) { | |
| if (is.logical(Rowv) && (Rowv)) | |
| dendrogram <- "row" | |
| else dendrogram <- "none" | |
| warning("Discrepancy: Colv is FALSE, while dendrogram is `", | |
| dendrogram, "'. Omitting column dendogram.") | |
| } | |
| } | |
| if (inherits(Rowv, "dendrogram")) { | |
| ddr <- Rowv | |
| rowInd <- order.dendrogram(ddr) | |
| } | |
| else if (is.integer(Rowv)) { | |
| hcr <- hclustfun(distfun(x)) | |
| ddr <- as.dendrogram(hcr) | |
| ddr <- reorder(ddr, Rowv) | |
| rowInd <- order.dendrogram(ddr) | |
| if (nr != length(rowInd)) | |
| stop("row dendrogram ordering gave index of wrong length") | |
| } | |
| else if (isTRUE(Rowv)) { | |
| Rowv <- rowMeans(x, na.rm = na.rm) | |
| hcr <- hclustfun(distfun(x)) | |
| ddr <- as.dendrogram(hcr) | |
| ddr <- reorder(ddr, Rowv) | |
| rowInd <- order.dendrogram(ddr) | |
| if (nr != length(rowInd)) | |
| stop("row dendrogram ordering gave index of wrong length") | |
| } | |
| else { | |
| rowInd <- nr:1 | |
| } | |
| if (inherits(Colv, "dendrogram")) { | |
| ddc <- Colv | |
| colInd <- order.dendrogram(ddc) | |
| } | |
| else if (identical(Colv, "Rowv")) { | |
| if (nr != nc) | |
| stop("Colv = \"Rowv\" but nrow(x) != ncol(x)") | |
| if (exists("ddr")) { | |
| ddc <- ddr | |
| colInd <- order.dendrogram(ddc) | |
| } | |
| else colInd <- rowInd | |
| } | |
| else if (is.integer(Colv)) { | |
| hcc <- hclustfun(distfun(if (symm) | |
| x | |
| else t(x))) | |
| ddc <- as.dendrogram(hcc) | |
| ddc <- reorder(ddc, Colv) | |
| colInd <- order.dendrogram(ddc) | |
| if (nc != length(colInd)) | |
| stop("column dendrogram ordering gave index of wrong length") | |
| } | |
| else if (isTRUE(Colv)) { | |
| Colv <- colMeans(x, na.rm = na.rm) | |
| hcc <- hclustfun(distfun(if (symm) | |
| x | |
| else t(x))) | |
| ddc <- as.dendrogram(hcc) | |
| ddc <- reorder(ddc, Colv) | |
| colInd <- order.dendrogram(ddc) | |
| if (nc != length(colInd)) | |
| stop("column dendrogram ordering gave index of wrong length") | |
| } | |
| else { | |
| colInd <- 1:nc | |
| } | |
| retval$rowInd <- rowInd | |
| retval$colInd <- colInd | |
| retval$call <- match.call() | |
| x <- x[rowInd, colInd] | |
| x.unscaled <- x | |
| cellnote <- cellnote[rowInd, colInd] | |
| if (is.null(labRow)) | |
| labRow <- if (is.null(rownames(x))) | |
| (1:nr)[rowInd] | |
| else rownames(x) | |
| else labRow <- labRow[rowInd] | |
| if (is.null(labCol)) | |
| labCol <- if (is.null(colnames(x))) | |
| (1:nc)[colInd] | |
| else colnames(x) | |
| else labCol <- labCol[colInd] | |
| if (scale == "row") { | |
| retval$rowMeans <- rm <- rowMeans(x, na.rm = na.rm) | |
| x <- sweep(x, 1, rm) | |
| retval$rowSDs <- sx <- apply(x, 1, sd, na.rm = na.rm) | |
| x <- sweep(x, 1, sx, "/") | |
| } | |
| else if (scale == "column") { | |
| retval$colMeans <- rm <- colMeans(x, na.rm = na.rm) | |
| x <- sweep(x, 2, rm) | |
| retval$colSDs <- sx <- apply(x, 2, sd, na.rm = na.rm) | |
| x <- sweep(x, 2, sx, "/") | |
| } | |
| if (missing(breaks) || is.null(breaks) || length(breaks) < 1) { | |
| if (missing(col) || is.function(col)) | |
| breaks <- 16 | |
| else breaks <- length(col) + 1 | |
| } | |
| if (length(breaks) == 1) { | |
| if (!symbreaks) | |
| breaks <- seq(min(x, na.rm = na.rm), max(x, na.rm = na.rm), | |
| length = breaks) | |
| else { | |
| extreme <- max(abs(x), na.rm = TRUE) | |
| breaks <- seq(-extreme, extreme, length = breaks) | |
| } | |
| } | |
| nbr <- length(breaks) | |
| ncol <- length(breaks) - 1 | |
| if (class(col) == "function") | |
| col <- col(ncol) | |
| min.breaks <- min(breaks) | |
| max.breaks <- max(breaks) | |
| x[x < min.breaks] <- min.breaks | |
| x[x > max.breaks] <- max.breaks | |
| if (missing(lhei) || is.null(lhei)) | |
| lhei <- c(keysize, 4) | |
| if (missing(lwid) || is.null(lwid)) | |
| lwid <- c(keysize, 4) | |
| if (missing(lmat) || is.null(lmat)) { | |
| lmat <- rbind(4:3, 2:1) | |
| if (!missing(ColSideColors)) { | |
| #if (!is.matrix(ColSideColors)) | |
| #stop("'ColSideColors' must be a matrix") | |
| if (!is.character(ColSideColors) || nrow(ColSideColors) != nc) | |
| stop("'ColSideColors' must be a matrix of nrow(x) rows") | |
| lmat <- rbind(lmat[1, ] + 1, c(NA, 1), lmat[2, ] + 1) | |
| #lhei <- c(lhei[1], 0.2, lhei[2]) | |
| lhei=c(lhei[1], side.height.fraction*NumColSideColors, lhei[2]) | |
| } | |
| if (!missing(RowSideColors)) { | |
| #if (!is.matrix(RowSideColors)) | |
| #stop("'RowSideColors' must be a matrix") | |
| if (!is.character(RowSideColors) || ncol(RowSideColors) != nr) | |
| stop("'RowSideColors' must be a matrix of ncol(x) columns") | |
| lmat <- cbind(lmat[, 1] + 1, c(rep(NA, nrow(lmat) - 1), 1), lmat[,2] + 1) | |
| #lwid <- c(lwid[1], 0.2, lwid[2]) | |
| lwid <- c(lwid[1], side.height.fraction*NumRowSideColors, lwid[2]) | |
| } | |
| lmat[is.na(lmat)] <- 0 | |
| } | |
| if (length(lhei) != nrow(lmat)) | |
| stop("lhei must have length = nrow(lmat) = ", nrow(lmat)) | |
| if (length(lwid) != ncol(lmat)) | |
| stop("lwid must have length = ncol(lmat) =", ncol(lmat)) | |
| op <- par(no.readonly = TRUE) | |
| on.exit(par(op)) | |
| layout(lmat, widths = lwid, heights = lhei, respect = FALSE) | |
| if (!missing(RowSideColors)) { | |
| if (!is.matrix(RowSideColors)){ | |
| par(mar = c(margins[1], 0, 0, 0.5)) | |
| image(rbind(1:nr), col = RowSideColors[rowInd], axes = FALSE) | |
| } else { | |
| par(mar = c(margins[1], 0, 0, 0.5)) | |
| rsc = t(RowSideColors[,rowInd, drop=F]) | |
| rsc.colors = matrix() | |
| rsc.names = names(table(rsc)) | |
| rsc.i = 1 | |
| for (rsc.name in rsc.names) { | |
| rsc.colors[rsc.i] = rsc.name | |
| rsc[rsc == rsc.name] = rsc.i | |
| rsc.i = rsc.i + 1 | |
| } | |
| rsc = matrix(as.numeric(rsc), nrow = dim(rsc)[1]) | |
| image(t(rsc), col = as.vector(rsc.colors), axes = FALSE) | |
| if (length(colnames(RowSideColors)) > 0) { | |
| axis(1, 0:(dim(rsc)[2] - 1)/(dim(rsc)[2] - 1), colnames(RowSideColors), las = 2, tick = FALSE) | |
| } | |
| } | |
| } | |
| if (!missing(ColSideColors)) { | |
| if (!is.matrix(ColSideColors)){ | |
| par(mar = c(0.5, 0, 0, margins[2])) | |
| image(cbind(1:nc), col = ColSideColors[colInd], axes = FALSE) | |
| } else { | |
| par(mar = c(0.5, 0, 0, margins[2])) | |
| csc = ColSideColors[colInd, , drop=F] | |
| csc.colors = matrix() | |
| csc.names = names(table(csc)) | |
| csc.i = 1 | |
| for (csc.name in csc.names) { | |
| csc.colors[csc.i] = csc.name | |
| csc[csc == csc.name] = csc.i | |
| csc.i = csc.i + 1 | |
| } | |
| csc = matrix(as.numeric(csc), nrow = dim(csc)[1]) | |
| image(csc, col = as.vector(csc.colors), axes = FALSE) | |
| if (length(colnames(ColSideColors)) > 0) { | |
| axis(2, 0:(dim(csc)[2] - 1)/max(1,(dim(csc)[2] - 1)), colnames(ColSideColors), las = 2, tick = FALSE) | |
| } | |
| } | |
| } | |
| par(mar = c(margins[1], 0, 0, margins[2])) | |
| x <- t(x) | |
| cellnote <- t(cellnote) | |
| if (revC) { | |
| iy <- nr:1 | |
| if (exists("ddr")) | |
| ddr <- rev(ddr) | |
| x <- x[, iy] | |
| cellnote <- cellnote[, iy] | |
| } | |
| else iy <- 1:nr | |
| image(1:nc, 1:nr, x, xlim = 0.5 + c(0, nc), ylim = 0.5 + c(0, nr), axes = FALSE, xlab = "", ylab = "", col = col, breaks = breaks, ...) | |
| retval$carpet <- x | |
| if (exists("ddr")) | |
| retval$rowDendrogram <- ddr | |
| if (exists("ddc")) | |
| retval$colDendrogram <- ddc | |
| retval$breaks <- breaks | |
| retval$col <- col | |
| if (!invalid(na.color) & any(is.na(x))) { # load library(gplots) | |
| mmat <- ifelse(is.na(x), 1, NA) | |
| image(1:nc, 1:nr, mmat, axes = FALSE, xlab = "", ylab = "", | |
| col = na.color, add = TRUE) | |
| } | |
| axis(1, 1:nc, labels = labCol, las = 2, line = -0.5, tick = 0, | |
| cex.axis = cexCol) | |
| if (!is.null(xlab)) | |
| mtext(xlab, side = 1, line = margins[1] - 1.25) | |
| axis(4, iy, labels = labRow, las = 2, line = -0.5, tick = 0, | |
| cex.axis = cexRow) | |
| if (!is.null(ylab)) | |
| mtext(ylab, side = 4, line = margins[2] - 1.25) | |
| if (!missing(add.expr)) | |
| eval(substitute(add.expr)) | |
| if (!missing(colsep)) | |
| for (csep in colsep) rect(xleft = csep + 0.5, ybottom = rep(0, length(csep)), xright = csep + 0.5 + sepwidth[1], ytop = rep(ncol(x) + 1, csep), lty = 1, lwd = 1, col = sepcolor, border = sepcolor) | |
| if (!missing(rowsep)) | |
| for (rsep in rowsep) rect(xleft = 0, ybottom = (ncol(x) + 1 - rsep) - 0.5, xright = nrow(x) + 1, ytop = (ncol(x) + 1 - rsep) - 0.5 - sepwidth[2], lty = 1, lwd = 1, col = sepcolor, border = sepcolor) | |
| min.scale <- min(breaks) | |
| max.scale <- max(breaks) | |
| x.scaled <- scale01(t(x), min.scale, max.scale) | |
| if (trace %in% c("both", "column")) { | |
| retval$vline <- vline | |
| vline.vals <- scale01(vline, min.scale, max.scale) | |
| for (i in colInd) { | |
| if (!is.null(vline)) { | |
| abline(v = i - 0.5 + vline.vals, col = linecol, | |
| lty = 2) | |
| } | |
| xv <- rep(i, nrow(x.scaled)) + x.scaled[, i] - 0.5 | |
| xv <- c(xv[1], xv) | |
| yv <- 1:length(xv) - 0.5 | |
| lines(x = xv, y = yv, lwd = 1, col = tracecol, type = "s") | |
| } | |
| } | |
| if (trace %in% c("both", "row")) { | |
| retval$hline <- hline | |
| hline.vals <- scale01(hline, min.scale, max.scale) | |
| for (i in rowInd) { | |
| if (!is.null(hline)) { | |
| abline(h = i + hline, col = linecol, lty = 2) | |
| } | |
| yv <- rep(i, ncol(x.scaled)) + x.scaled[i, ] - 0.5 | |
| yv <- rev(c(yv[1], yv)) | |
| xv <- length(yv):1 - 0.5 | |
| lines(x = xv, y = yv, lwd = 1, col = tracecol, type = "s") | |
| } | |
| } | |
| if (!missing(cellnote)) | |
| text(x = c(row(cellnote)), y = c(col(cellnote)), labels = c(cellnote), | |
| col = notecol, cex = notecex) | |
| par(mar = c(margins[1], 0, 0, 0)) | |
| if (dendrogram %in% c("both", "row")) { | |
| plot(ddr, horiz = TRUE, axes = FALSE, yaxs = "i", leaflab = "none") | |
| } | |
| else plot.new() | |
| par(mar = c(0, 0, if (!is.null(main)) 5 else 0, margins[2])) | |
| if (dendrogram %in% c("both", "column")) { | |
| plot(ddc, axes = FALSE, xaxs = "i", leaflab = "none") | |
| } | |
| else plot.new() | |
| if (!is.null(main)) | |
| title(main, cex.main = 1.5 * op[["cex.main"]]) | |
| if (key) { | |
| par(mar = c(5, 4, 2, 1), cex = 0.75) | |
| tmpbreaks <- breaks | |
| if (symkey) { | |
| max.raw <- max(abs(c(x, breaks)), na.rm = TRUE) | |
| min.raw <- -max.raw | |
| tmpbreaks[1] <- -max(abs(x), na.rm = TRUE) | |
| tmpbreaks[length(tmpbreaks)] <- max(abs(x), na.rm = TRUE) | |
| } | |
| else { | |
| min.raw <- min(x, na.rm = TRUE) | |
| max.raw <- max(x, na.rm = TRUE) | |
| } | |
| z <- seq(min.raw, max.raw, length = length(col)) | |
| image(z = matrix(z, ncol = 1), col = col, breaks = tmpbreaks, | |
| xaxt = "n", yaxt = "n") | |
| par(usr = c(0, 1, 0, 1)) | |
| lv <- pretty(breaks) | |
| xv <- scale01(as.numeric(lv), min.raw, max.raw) | |
| axis(1, at = xv, labels = lv) | |
| if (scale == "row") | |
| mtext(side = 1, "Row Z-Score", line = 2) | |
| else if (scale == "column") | |
| mtext(side = 1, "Column Z-Score", line = 2) | |
| else mtext(side = 1, KeyValueName, line = 2) | |
| if (density.info == "density") { | |
| dens <- density(x, adjust = densadj, na.rm = TRUE) | |
| omit <- dens$x < min(breaks) | dens$x > max(breaks) | |
| dens$x <- dens$x[-omit] | |
| dens$y <- dens$y[-omit] | |
| dens$x <- scale01(dens$x, min.raw, max.raw) | |
| lines(dens$x, dens$y/max(dens$y) * 0.95, col = denscol, | |
| lwd = 1) | |
| axis(2, at = pretty(dens$y)/max(dens$y) * 0.95, pretty(dens$y)) | |
| title("Color Key\nand Density Plot") | |
| par(cex = 0.5) | |
| mtext(side = 2, "Density", line = 2) | |
| } | |
| else if (density.info == "histogram") { | |
| h <- hist(x, plot = FALSE, breaks = breaks) | |
| hx <- scale01(breaks, min.raw, max.raw) | |
| hy <- c(h$counts, h$counts[length(h$counts)]) | |
| lines(hx, hy/max(hy) * 0.95, lwd = 1, type = "s", | |
| col = denscol) | |
| axis(2, at = pretty(hy)/max(hy) * 0.95, pretty(hy)) | |
| title("Color Key\nand Histogram") | |
| par(cex = 0.5) | |
| mtext(side = 2, "Count", line = 2) | |
| } | |
| else title("Color Key") | |
| } | |
| else plot.new() | |
| retval$colorTable <- data.frame(low = retval$breaks[-length(retval$breaks)], | |
| high = retval$breaks[-1], color = retval$col) | |
| invisible(retval) | |
| } |
I have been using this quite liberally for a while now and noticed it wasn't published with a license. I assume it must be GPL2 since heatmap.2 is also under GPL2.
By the way publishing something like this without copyright information means you are publishing it in all rights reserved form. Which is fine normally but in this case I don't think you are allowed to do it because of the terms of the original license.
How to color groups of rows in specific color within the heatmap
Sign up for free
to join this conversation on GitHub.
Already have an account?
Sign in to comment
groobie. FYI the "revC" option was just copied directly from heatmap.2 (gplots) and not part of the minor hacking done here. That comment should probably be submitted to the authors of heatmap.2. I've never used the revC option and don't really know what it is intended to do, even after reading the docs on it.