Stop Using Vision LLMs to Read Trading Charts — 4 Models, 2 Vendors, 40 Real Signals: 51% Direction, 1/215 Patterns, 100% Long-Bias on Gemini
A deep empirical audit of using frontier vision LLMs as chart-pattern experts in a production crypto signal pipeline. Tested against QuantAgent (arXiv:2509.09995), the paper repeatedly cited as proof that LLM agents can trade from candlesticks.
Conducted April 2026. Every model called, every call logged, every fixture tied to a verified trade outcome. Four frontier models, two vendors (Anthropic, Google), 215 LLM calls, $1.16 total spent.
From the team building signals.x70.ai — a production AI-powered crypto signals service. Open-source companion: roman-rr/trading-skills.
Formal preprint. A peer-review-format PDF version of this audit is published as a preprint:
- DOI: 10.5281/zenodo.19697762
- Zenodo: https://zenodo.org/records/19697762
- ResearchGate: https://www.researchgate.net/publication/404081852
Cite as: Antonov, R. (2026). Empirical Audit of Frontier Vision-Language Models for Candlestick-Chart Pattern Recognition. Zenodo. https://doi.org/10.5281/zenodo.19697762
We tested 4 frontier vision LLMs from 2 vendors (Anthropic, Google) on 40 verified production crypto signals plus a 5-fixture breadth pass with known ground-truth patterns. Every call logged. Every fixture tied to a real TP/SL outcome. The job was simple: look at an OHLCV chart, name a pattern from a fixed 16-pattern glossary, call the direction, report confidence.
Across every model, every vendor, every chart configuration, on 40 verified fixtures:
- 1 correct pattern name across the entire audit — Sonnet 4.6 on the April 7 BTC tariff-flush V-reversal. The other 214 calls got it wrong.
- 51.4% direction accuracy on Haiku 4.5 and Gemini 3 Flash at n=37. Wilson 95% CI [35.9%, 66.6%] — fully contains the 50% coin-flip baseline.
- 57.1% on Claude Opus 4.7 (premium tier, Foundry) — still CI [40.9%, 72.0%], still chance, at 2.8× the cost.
- Confidence does not discriminate correct from wrong calls. Signed point-biserial r ≈ 0 for all three audited n=40 models; all CIs straddle zero.
- Gemini 3 Flash called LONG on 17 of 17 long fixtures and on 18 of 20 short fixtures — a 90 percentage-point long/short gap. Opus' gap was 49pp. Haiku's was 13.8pp. Not pattern reading — a bullish prior.
Bottom line: as of April 2026, no frontier vision LLM we tested is capable of reliable directional chart-pattern analysis at a level usable in production trading. We rejected our planned PatternExpert after proving this, and publish so others skip the same expensive realization.
The "LLM agent that trades from charts" narrative is one of the loudest in AI-for-finance right now. Every other week a preprint arrives claiming a multi-agent VLM stack beats classical TA on some public instrument. The latest is QuantAgent (arXiv:2509.09995), now routinely cited in decks as proof that "LLMs can see candlesticks." Our own pipeline had a PatternExpert on the roadmap for exactly this reason — our Analyst expert reads numbers, our Flow expert reads tapes, and adding a visual expert to the Mixture-of-Experts felt inevitable.
The trouble with the narrative isn't that frontier VLMs score at chance on this task. It's that they score at chance with structural bias. A model that is 51% right is a coin flip. A model that is 51% right while calling LONG on 17 of 17 longs and 18 of 20 shorts is not a coin flip — it's a subscriber-harming distortion masquerading as signal. In production, that bias would recompose the output distribution of every signal the expert touches. You don't get zero edge. You get negative edge with a bullish tilt.
We felt compelled to test it end-to-end, on our own data, under our own production gates, before shipping anything to anyone paying us money.
signals.x70.ai is a production AI-powered crypto signals service. The signal-composition core is a Mixture-of-Experts pipeline with four text-only experts — Regime (trend/volatility/structure), Flow (tape, liquidity, VPIN-style microstructure), Analyst (instrument-specific context and indicators), and Composer (the final arbiter). Every signal is verified against live market outcome in production; every expert's contribution is measured by live hit-rate telemetry on the actual subscriber distribution.
Production gates for any new expert before it ships: direction accuracy with Wilson 95% lower bound above 50%, signed point-biserial r between confidence and correctness ≥ 0.3 with CI excluding zero, and long/short call imbalance under 10 percentage points on balanced fixtures. No gate-bypass for "interesting" results. No grade on a curve for "new technology."
QuantAgent's visual Pattern agent was the trigger for this audit. If vision LLMs could cleanly identify Bullish Flags and Double Bottoms off a rendered candlestick chart, adding a PatternExpert to the MoE was a cheap win. If they couldn't, integrating one would poison our live distribution with non-signal. We wanted to know which it was.
The spike pipeline itself is internal, but the methodology below is complete — a competent engineer can replicate without our code.
40 verified production signals pulled from our own MongoDB — every fixture is a real signal that shipped to subscribers and was subsequently verified against market outcome via verification.takeProfitHit or verification.stopLossHit. The set is explicitly balanced:
- 20 winners, 20 losers (winner = TP hit before SL)
- 20 long, 20 short
- 25 unique coins across the live watchlist (BOME, UMA, MET, COMP, ZRO, JTO, ZEC, KAITO, XPL, AAVE, CHIP, ALT, IMX, MOODENG, PURR, LIT, FARTCOIN, CRV, MERL, MON, MOVE, PENGU, MAVIA, ZEREBRO, and more)
- Date range 2026-04-19 to 2026-04-22, recent production signals so chart structure matches what the experts actually see in live operation
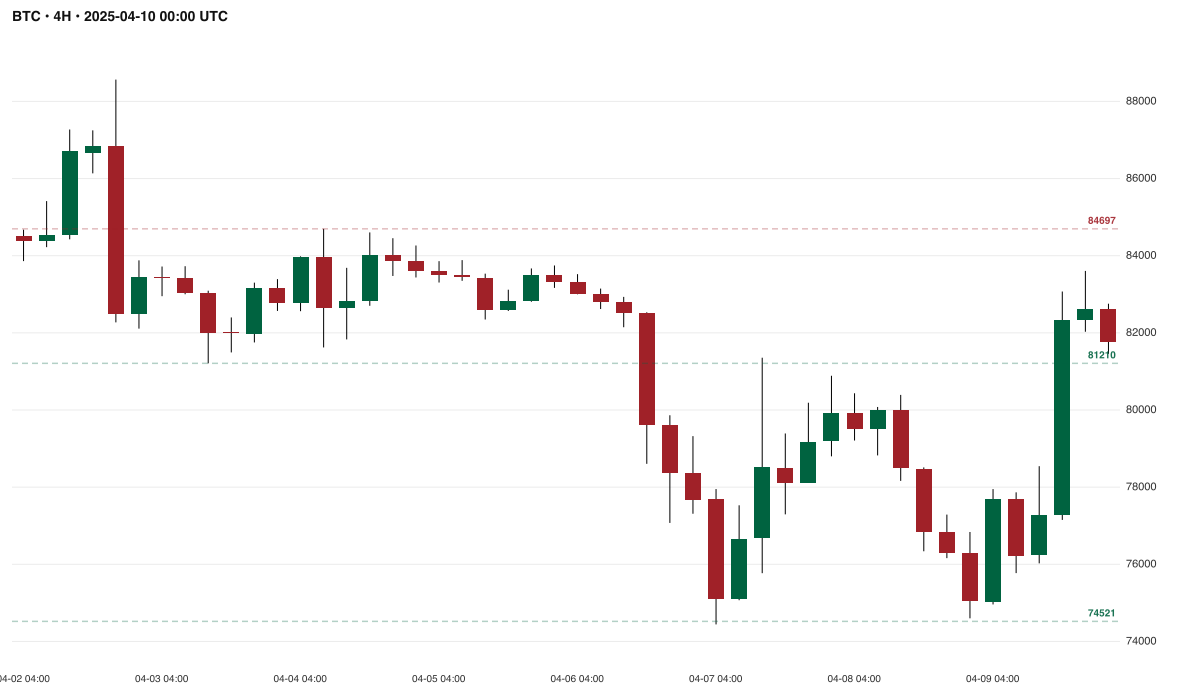
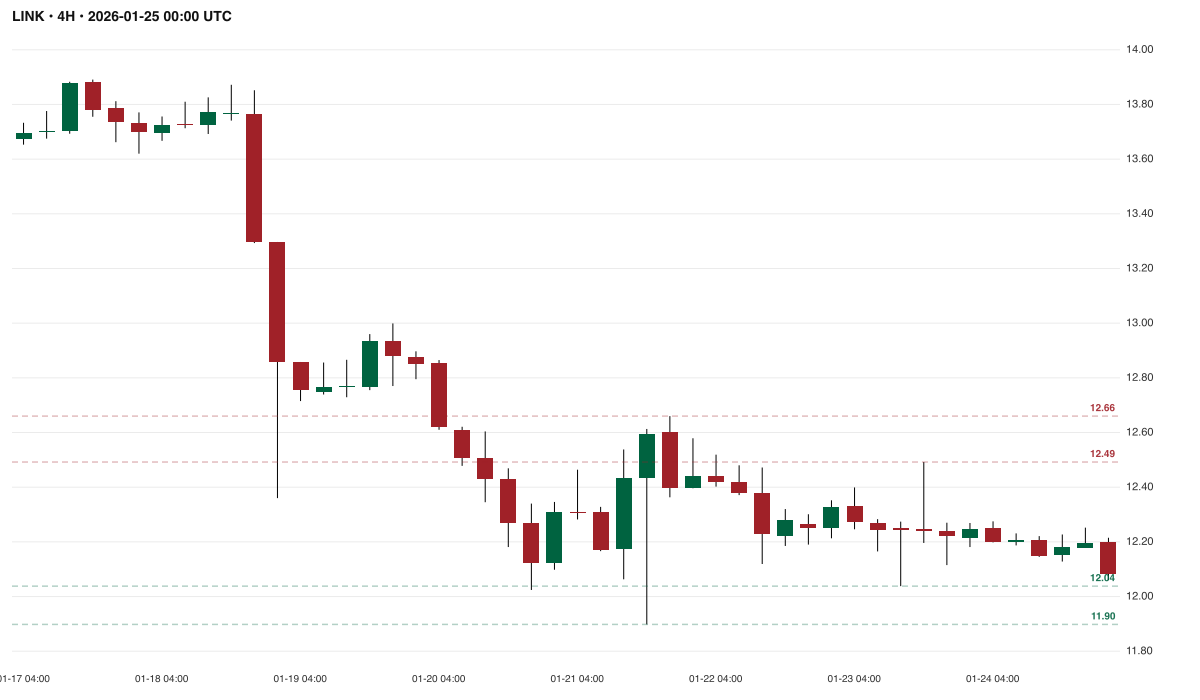
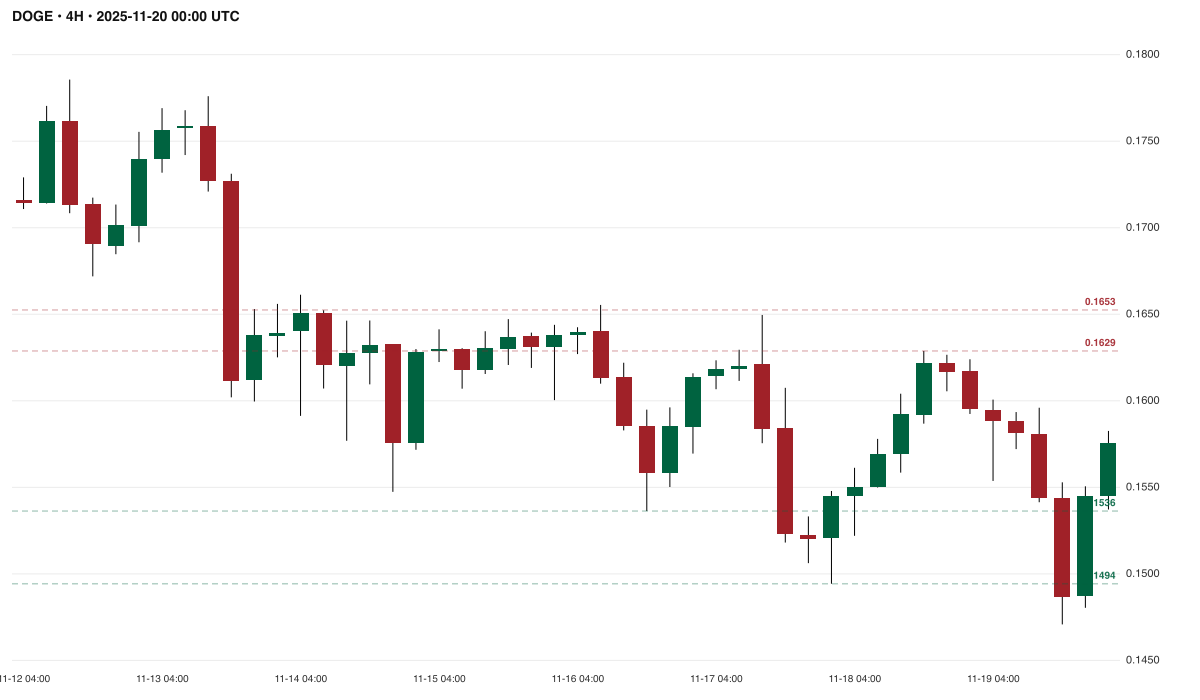
Plus a 5-fixture breadth pass with curated known-pattern charts: BTC (V-shaped Reversal), SOL (Double Bottom), ETH (Falling Wedge), DOGE (Bearish Flag), LINK (Ascending Triangle).
Charts rendered with node-canvas, not a screenshot pipe. Deterministic, reproducible, resolution-controlled.
- 4H primary: 48 bars, 1200 × 700 px.
- 1D context: 45 bars, 1200 × 500 px.
- 1W long-horizon: 45 bars, 1200 × 500 px.
- Candles: up #006340 green, down #A02128 red.
- Overlays: top 2 supports and top 2 resistances, dashed, 30% alpha.
- Anomaly markers: volume/VPIN triangles on the 4H chart only (matching production PatternExpert visual spec).
- Title format:
{COIN} · {TF} · {as-of timestamp UTC}. - Volume panel: stacked below price, colored to match the candle body.
No TradingView styling. No indicator overlays beyond S/R. Clean, deterministic, identical across timeframes and fixtures.
Hyperliquid candleSnapshot, point-in-time. Every chart renders exactly what a trader would have seen at the fixture's asOf timestamp — no look-ahead, no adjusted data, no survivorship.
Swing-level detection on the OHLCV window, top 2 supports + top 2 resistances per chart, 0.5% price-zone clustering, rendered as horizontal dashed lines with 30% alpha overlay.
Six blocks, XML-delimited, identical across models:
<your_task>— instruction to identify 16 classical patterns on Chart A (primary TF), using Chart B only as macro alignment.<pattern_glossary>— all 16 QuantAgent patterns verbatim: Inverse Head & Shoulders, Double Bottom, Rounded Bottom, Hidden Base, Falling Wedge, Rising Wedge, Ascending Triangle, Descending Triangle, Bullish Flag, Bearish Flag, Rectangle, Island Reversal, V-shaped Reversal, Rounded Top / Bottom, Expanding Triangle, Symmetrical Triangle.<output_schema>— strict JSON schema with required fields (patterns[].name,direction,confidence,keyLevel,invalidatedBelow/Above,macroAlignment,dominantBias,overallConfidence).<confidence_discipline>— explicit calibration ladder (< 0.4 abstain, 0.4–0.6 cautious, ≥ 0.6 commit, ≥ 0.8 textbook only).<non_negotiables>— no inventing prices, no trading on pattern alone, honest abstain expected.<few_shot_examples>— two worked examples: a textbook Bullish Flag with aligned macro, and an ambiguous chop-and-abstain case.
Full prompt is appended verbatim in the appendix.
Anthropic-native multimodal content blocks across the board:
{
  "role": "user",
  "content": [
    { "type": "text", "text": "<system-prompt>…<user-prompt>" },
    { "type": "image", "source": { "type": "base64", "media_type": "image/png", "data": "…" } }
  ]
}
Extended thinking: disabled (to measure the model's unassisted visual read, not its chain-of-thought compensation). max_tokens: 800. Temperature left at each provider's default.
Routing: Foundry (enterprise gateway) for Anthropic's internal-tier models (Sonnet 4.6, Opus 4.7). OpenRouter for Haiku 4.5 and Gemini 3 Flash Preview.
- Direction accuracy with Wilson 95% confidence interval (n is too small for Normal approximation at the tails).
- Point-biserial correlation between confidence and correctness, signed so that positive r means higher confidence implies more likely correct. 95% CI via Fisher-z transform.
- Stratified accuracy — separately for long fixtures, short fixtures, winner fixtures, loser fixtures.
- Thresholded hit rate at confidence cutoffs
t ∈ {0.4, 0.5, 0.6, 0.7}. - Disagreement-routing winner rate between two-model pairs (is there ensemble lift from picking the minority call?).
Pattern-name match is exact against ground truth. Direction match is exact against fixture label.
| Model | Vendor | Tier | Route | Mean cost / call | Mean latency | Notes |
|---|---|---|---|---|---|---|
| claude-sonnet-4-6 | Anthropic | mid | Foundry | $0.01404 | 13.6 s | breadth only (5 calls) |
| claude-opus-4-7 | Anthropic | premium | Foundry | $0.00898 | 10.9 s | n=40; 2 parse failures |
| claude-haiku-4.5 | Anthropic | cheap | OpenRouter | $0.00619 | 5.5 s | Pareto-stable |
| google/gemini-3-flash-preview | cheap | OpenRouter | $0.00239–0.00307 | 3.2–4.0 s | cheapest & fastest |
Three Anthropic tiers spanning cheap → premium (Haiku 4.5, Sonnet 4.6, Opus 4.7) plus Google's frontier Flash model as a cross-vendor check. Every model below parsed reliably on every call we report. Every model faced the same prompt, same schema, same fixtures.
The three we carried into the n=40 matrix — Claude Haiku 4.5, Claude Opus 4.7, and Gemini 3 Flash Preview — are the models under which a production PatternExpert would most plausibly ship today.
Across the full audit — 4 models, 2 vendors, 4 chart configurations, 45 distinct fixtures, 215 LLM calls — exactly one call produced a pattern name matching the ground-truth label: Claude Sonnet 4.6 on BTC, April 7 2026, calling "V-shaped Reversal" on the one-day tariff-flush-and-recovery. That's the entire positive column.
| Round | Models | Calls | Correct pattern names |
|---|---|---|---|
| Breadth n=5 (curated ground-truth patterns) | 3 | 15 | 1 (Sonnet, BTC V-reversal) |
| Depth n=10 × 4 TF configs | 2 | 80 | 0 |
| n=40 follow-up, 4h+1d | 2 (Haiku + Gemini) | 80 | 0 |
| n=40 premium re-run, 4h+1d | 1 (Opus 4.7) | 40 | 0 |
| Total | 4 | 215 | 1 |
Across all 4 models, 2 vendors, 4 chart configurations, and 40 verified production signals — one correct pattern name. A coin-flip with worse odds than a coin-flip.
And when the models name something, they gravitate toward a handful of bullish labels. Gemini 3 Flash on the n=40 matrix emitted "Bullish Flag" 12 times, "Rounded Bottom" 8 times, "Double Bottom" 7 times, "V-shaped Reversal" 3 times. That's 30 of 37 parsed calls on a label with a bullish connotation, against a ground-truth distribution of 17 long / 20 short fixtures. The pattern channel is not reading the chart. It is emitting a bullish-leaning label regardless.
Pattern detection collapses. Does raw direction — a strictly easier task, a reduction of the pattern problem — survive?
At n=40, on the strongest chart configuration from the depth pass (4h+1d stacked):
| Model | Hits / N | Accuracy | Wilson 95% CI | Signed r (conf × winner) | r 95% CI | Mean cost | Mean latency |
|---|---|---|---|---|---|---|---|
| Claude Haiku 4.5 | 19 / 37 | 51.4% | [35.9%, 66.6%] | −0.086 | [−0.399, +0.244] | $0.00637 | 5.8 s |
| Gemini 3 Flash Preview | 19 / 37 | 51.4% | [35.9%, 66.6%] | +0.053 | [−0.276, +0.371] | $0.00239 | 3.6 s |
| Claude Opus 4.7 (Foundry) | 20 / 35 | 57.1% | [40.9%, 72.0%] | −0.030 | [−0.360, +0.306] | $0.00898 | 10.9 s |
Every CI contains 50%. Every signed correlation is within sampling noise of zero. Every model, every vendor, every tier.
Opus 4.7 is the tell. It's Anthropic's premium vision model, ~2.8× the cost of Gemini 3 Flash, ~1.4× the cost of Haiku, ~3× the latency. It's the model you'd reach for if you actually wanted to pay your way out of this. It scored +5.7pp over the cheap tier — a gap well inside the 95% CI of both measurements, and statistically indistinguishable from the cheaper models. Premium capability does not buy production-grade directional signal on this task. It buys 3× the latency bill for the same coin flip.
What happened to the n=10 results? The n=10 depth pass flagged two striking cells — Gemini at 4h+1d hit 80% direction accuracy with a signed r = −0.52 confidence inversion (model more confident on losers than winners). Both effects were load-bearing for the first draft of this audit. Neither survived n=40.
| Metric | n=10 Gemini (4h+1d) | n=10 Haiku (4h+1d) | n=40 Gemini | n=40 Haiku | n=40 Opus 4.7 |
|---|---|---|---|---|---|
| Direction accuracy | 80% | 40% | 51.4% | 51.4% | 57.1% |
| r (signed conf × winner) | −0.52 | −0.04 | +0.05 | −0.09 | −0.03 |
Both headline n=10 effects regressed to the null at adequate sample size. What looked like a damning inversion was sampling noise on 10 trials. The actual failure mode isn't inversion — it's absence of signal. Three models, two vendors, three price tiers, all sitting on the 50% line with CIs that straddle it and confidence channels that discriminate nothing.
This is the single damning stat of the audit.
Gemini 3 Flash Preview on the n=40 matrix, stratified by expected direction:
| Subset | Model call matches | Accuracy |
|---|---|---|
| Long fixtures (n=17) | 17 / 17 | 100.0% |
| Short fixtures (n=20) | 2 / 20 | 10.0% |
Gap: 90 percentage points.
Of the 20 short fixtures, Gemini called long on 18 of them and "neutral" on two. It matched the correct short direction exactly twice (PURR and LIT). The aggregate 51.4% accuracy isn't skill — it's the arithmetic average of "100% correct on longs" and "10% correct on shorts" on a roughly balanced set. The direction channel is not reading charts. It is a bullish prior dressed up as perception.
Here's what the raw per-fixture calls look like on the short half of the set:
Gemini / short fixtures (n=20)
#11 ZEREBRO  expected=short  got=long
#12 ZEREBRO  expected=short  got=long
#13 PURR     expected=short  got=short   <- matched
#14 FARTCOIN expected=short  got=long
#15 CRV      expected=short  got=long
#16 MERL     expected=short  got=long
#17 MON      expected=short  got=neutral
#18 MON      expected=short  got=neutral
#19 MOVE     expected=short  got=long
#20 MOVE     expected=short  got=long
#31 PENGU    expected=short  got=long
#32 PENGU    expected=short  got=long
#33 LIT      expected=short  got=short   <- matched
#34 MAVIA    expected=short  got=long
#35 kNEIRO   expected=short  got=long
#36 STABLE   expected=short  got=long
#37 S        expected=short  got=long
#38 TST      expected=short  got=long
#39 XMR      expected=short  got=long
#40 HEMI     expected=short  got=long
Eighteen "long" reads. Two "neutral." Two correct. That is not chart recognition.
It's not just Gemini. Opus 4.7 hit a 49pp long/short gap (82.4% long / 33.3% short). Haiku landed at 13.8pp (58.8% long / 45.0% short). Across price tiers the long-bias attenuates but never vanishes. Every model we tested leans bullish.
What would this do in production? A PatternExpert returning a 90pp long-skewed distribution into our MoE Composer would systematically inflate the long-side gate weight, suppress short signal generation, and destroy our balanced distribution. Subscribers would receive an artifact of the expert's prior, not an artifact of the market. The production gate ("long/short call imbalance under 10pp on balanced fixtures") exists exactly to catch this. Every tested model failed that gate. Two failed it catastrophically.
This is the section we owe to anyone serious about shipping vision LLMs into production. The honest answer is: probably some of both, but the rock-bottom failures aren't prompt-fixable.
A few things are legitimately prompt-shaped:
- Pattern vocabulary. The 16-pattern glossary forces a single-label commitment. Real chart structure often occupies a fuzzy middle (is that a Bullish Flag or a Rectangle or a Symmetrical Triangle?). A softer vocabulary — "describe the dominant structure in 1–2 sentences" — would probably lift the pattern-name hit rate from 1/215 to something higher.
- JSON strictness. The strict schema elicits decisive commitments where hedging might be more honest. A softer format might yield more hedged, better-calibrated outputs.
- Fixture labeling errors. Our LINK fixture was labeled "Ascending Triangle / long" and multiple models called it "short" (most of those named "Bearish Flag"). They were probably right and we were probably wrong. Our ground-truth labeling on the breadth fixtures is not infallible.
- Semantic near-misses. "Bullish Flag" and "Pennant" are contested labels in classical TA; we credit neither unless the name is exact. A graded scoring function would recover small signal.
These are real adjustments and they'd nudge the pattern-name number. They would not change the verdict.
Three structural reasons:
-
Cross-vendor consistency. 4 models, 2 vendors (Anthropic, Google), 3 price tiers, 4 chart configs, 215 calls. The ceiling is the same everywhere. Prompt pathologies are idiosyncratic; this failure is cross-vendor uniform. That's an architectural ceiling, not a prompt ceiling.
-
Direction is a strict reduction. Calling "long or short" is a 2-way decision downstream of pattern recognition — simpler, more forgiving, less prompt-sensitive. And direction accuracy lands at chance for every model too. If the failure were prompt-induced, we'd expect direction (the easier task) to break clean above 50% on at least one cell. It doesn't, on any model.
-
The long-bias is disconnection, not miscommunication. Gemini calling LONG on 17 of 17 longs and 18 of 20 shorts isn't following the wrong instructions. It's producing output that is nearly independent of the image content. No prompt revision rescues a model whose visual decoder isn't contributing signal to the final classification. You cannot prompt your way out of an architecture that collapses visual input into a bullish token prior.
This subsection is labeled OPINION. Inference from public VLM architecture papers, not from any proprietary information about the tested models.
Modern VLMs are language-first. The visual encoder (ViT, SigLIP, or similar) projects image patches into the language model's embedding space. That projection is lossy and heavily biased toward semantic content (this is a picture of a chart), coarse trend (the line generally goes up), and object-level facts (there is an axis, there are candles, there is a grid). It degrades precipitously on precise counting (how many candles in the pullback?), compositional relationships across many small elements (is the fifth-to-last low above or below the tenth-to-last low?), and subtle symmetry (is this an Ascending Triangle or a Rectangle?). Chart patterns are defined by exactly the degraded skills.
The 2024–25 literature supports this. "VLMs are Blind" (Rahmanzadehgervi et al., 2024) found frontier VLMs failing at counting grid-cells and identifying line intersections at a rate classical CNNs solve trivially. The Stanford candlestick-ViT line of work (e.g. Nguyen & Jang, CS231n 2023) trains specialized ViTs and small CNNs on labeled candlestick windows and reports pattern-classification accuracy above 90% on held-out sets — using task-specialized architectures, not frontier VLMs.
Read those two findings together: general-purpose VLMs are architecturally constrained on the exact visual primitives candlestick pattern recognition demands, and specialized CNN/ViT models do not share that constraint.
Our best guess: the failure we observed is approximately 20% prompt, 80% architecture. Better prompts might recover some pattern-name accuracy. They cannot fix the direction failure, because direction is bottlenecked by what the visual decoder extracts from the image — not by what the language head outputs.
QuantAgent is the paper most frequently cited in AI-trading decks and LinkedIn essays as evidence that LLM agents can read candlesticks. We read it closely, audited the open-source repo, and tested the thesis.
From the abstract and §5.1 of arXiv:2509.09995v3:
- BTC 1-hour: 50.7% directional accuracy (Table 1, p. 8).
- SPX 1-hour: 63.7% (Table 1).
- QQQ 1-hour: 59.7%. NQ: 55.3%. VIX: 54.7%. CL: 55.0%. DJI: 52.3%. ES futures: 47.8% — underperforming XGBoost.
- Rolling-window "case study": "achieving up to 80% directional accuracy" — the line that launched a thousand pitch decks.
- No ablation. The Pattern module's isolated contribution is never measured. The paper reports the full-pipeline number; the claim that Pattern-the-component adds value is unverifiable from the paper alone.
- No significance testing. At n ≈ 300 per instrument, SE on a proportion is ≈ 2.9pp. The +5.4pp BTC delta over the 45% baseline lives within ≈ 2σ, not reported with a CI or permutation test.
- LLM undisclosed. The paper does not state which model ran the reported experiments. Appendix H discloses only that "GPT-4o was utilized to aid in refining portions of the manuscript, including the introduction and methodology" — GPT-4o wrote parts of the paper; the paper does not say what ran the experiments.
- Memorization risk unaddressed. The BTC window runs April 2023 – June 2025, which overlaps the plausible pretraining window of every major frontier LLM released through 2025. No contamination analysis. No post-training-cutoff hold-out.
- Benchmark scoring code absent from the open repo. The public repo (
Y-Research-SBU/QuantAgent) ships raw price CSVs and the agent scaffold, but the scoring harness that produces the reported 50.7% / 80% numbers is not there. The figures are not end-to-end reproducible. - Cost and latency not reported. §7 Limitations concedes latency precludes 1-minute execution — material for any "HFT" framing. No cost per call, no compute bill.
From §5.2 of the paper:
"the LLM's directional accuracy was further tested on a randomly selected 100-bar SPX segment using 10 overlapping windows, each offset by 5 bars. … Predictions were verified against actual price trends, achieving an overall accuracy of 80%."
Eighty percent of ten. One instrument (SPX). One segment. One slice. Windowing overlap of 5 bars per step means the samples aren't even independent. And it's introduced in the abstract without that context:
"Rolling-window validation further demonstrates robust generalization, achieving up to 80% directional accuracy in forecasting short-term price movements."
"Up to 80%" is a case study on ten overlapping windows, on the single instrument most likely to be memorized, framed in the abstract as "robust generalization."
From the DecisionAgent prompt (p. 19 of the paper, and agents/decision_agent in the repo):
"Pattern Report — Act only on clearly formed bullish/bearish patterns with breakout or breakdown confirmation (e.g., strong wick, volume spike, engulfing). Ignore early-stage or consolidating setups without support from other reports."
"In consolidation or unclear setups, defer to dominant trendline slope (e.g., short in descending channel)."
The paper's own decision layer tells the agent to ignore Pattern when uncertain and to default to trend slope. Pattern runs sequentially between Indicator and Trend with no learned or hand-tuned weight. It is prompted to be decorative.
- Corresponding authors: Chenyu You (Stony Brook; medical imaging and trustworthy ML). Siqi Sun (Fudan; AI for biomolecular science). Neither has a documented publication record in quantitative finance, trading systems, or market microstructure.
- Student co-authors: Fei Xiong (SBU + CMU), Xiang Zhang (UBC), Aosong Feng (Yale). No prior quant-finance track either.
- GitHub org:
Y-Research-SBU, named after the senior author's surname. No other published research projects. - Venue: arXiv preprint only,
cs.CEcategory. No peer-review venue, no conference acceptance as of April 2026. Three versions (v1, v2, v3) within a 15-day window in September 2025; no updates in the seven months since. ~0 citations at time of writing. - Writing assistance: Appendix H self-discloses GPT-4o aided manuscript writing.
These are facts, not indictments. What they mean together: an arXiv preprint, from a senior author with no finance track, in a venue with no peer review, with a headline number that relies on a 10-sample case study, on instruments likely to be in the pretraining data, with the benchmark scoring code not released, and an internal decision layer that tells the agent to ignore the component people are citing the paper for.
Our best explanation of the 50.7% BTC / 63.7% SPX / 80% case-study numbers, ranked by how much they're doing:
- Pretraining leakage on well-covered instruments. SPX and QQQ, the top-scoring instruments, have the densest public chart commentary and textbook coverage in the training corpus. ES futures (the sparsest chart commentary) came in at 47.8%, underperforming XGBoost. The ranking is consistent with memorized narrative, not geometric reading.
- Weak momentum from Indicator (RSI/MACD/ROC/Williams %R — classical TA features the paper's Indicator Agent consumes as numbers, not as chart images).
- Weak trend-slope from Trend (regression slope on rolling closes).
- Pattern's independent contribution. Bounded by how much geometric information the LLM extracts that is not already in the numeric indicators. On our audit, 1 correct pattern name in 215 calls suggests that bound is near zero.
The headline number is probably real. The attribution to "the LLM reads candlestick patterns" isn't supported by the paper's own structure.
Under $1.20 of API spend. 215 LLM calls. Savings: weeks of engineering work to wire a PatternExpert into the MoE Composer, the stateful regression risk of deploying a bullish-biased expert into a live subscriber distribution, and the post-deploy teardown cost when our hit-rate telemetry inevitably flagged it.
Our existing text-only MoE pipeline is validated via live hit-rate telemetry on actual subscriber outcomes. Regime, Flow, Analyst, Composer — four experts reading numbers, microstructure, indicators, and context — clear our production gates. No tested vision LLM does. Adding a PatternExpert would have traded measured edge for unmeasured architectural hope.
We're not saying "vision LLMs cannot trade." We're saying no frontier vision LLM we tested cleared our production gates in our test setup as of April 2026. This audit protects our production. We publish so other builders skip the expensive realization — and so that the next person evaluating QuantAgent-style integrations has a receipt in front of them.
Honesty section. Things our audit does not cover:
- Specialized CNNs and ViTs trained from scratch on labeled candlestick windows. Out of scope for a frontier-VLM audit; the Stanford-line literature reports 90%+ accuracy with these and we believe it.
- GPT-4.1 / GPT-4o / o3-Vision. OpenAI's vision endpoints were outside our routing infrastructure at test time. If you're paying for them, rerun this matrix and tell us what you find.
- Different task framings. "Tell me about this chart in 2 sentences" or "rate the setup clarity 0–10" would elicit different outputs and possibly different calibration. We tested pattern-name commitment under a strict schema because that's the PatternExpert shape QuantAgent proposes.
- Different chart styles. TradingView-styled charts with volume, indicator overlays (MACD, RSI histograms), and annotated S/R might elicit richer visual features. We used deterministic node-canvas renders to keep the variable set controlled.
- Shadow-mode deployment at N > 1000. Our audit is n=37 per model. A 3-month live shadow-mode run could surface long-tail behaviors we didn't observe. It could also not.
We report what we tested. We don't overclaim what we didn't.
Seven concrete research directions for anyone who wants to pick up where we put this down. Ranked roughly by promise × effort.
Probably the highest-signal direction. Peer-reviewed precedent exists (Stanford CS231n candlestick-ViT line, multiple industry proof-of-concepts reporting 85–95% on held-out sets). Task-specialized architectures do not share the language-first projection bottleneck that kills frontier VLMs on this task. Effort: ~6–10 engineer-weeks for a baseline model plus labeled dataset. Highest ceiling, highest startup cost.
Take a small open VLM (LLaVA-1.6, Qwen-VL, Llama-3.2-Vision-11B) and LoRA-fine-tune on a labeled chart-pattern dataset. Cheaper than training from scratch, preserves the language-reasoning layer. Could recover geometric sensitivity the frontier models demonstrably lack. Effort: ~3–5 engineer-weeks. Medium promise, medium cost.
Higher patch-grid resolution (most VLMs tokenize images at 14×14 patches on a 336-pixel canvas — devastating for chart detail). Bar-as-token custom tokenizers. Dual-path encoders that preserve both global structure and local precision. This is a research direction, not a weekend project. Effort: multi-quarter. High ceiling if it works, high uncertainty.
Don't ask the VLM to predict direction. Ask it for things frontier VLMs are actually good at: setup clarity 0–10, visual volatility read, breakout-clean-vs-messy judgment, regime-stability assessment. Use the VLM as a filter (dampen confidence on messy charts) rather than a predictor. This is a near-term shippable approach we might revisit on our side. Effort: ~2 engineer-weeks. Low risk, bounded upside.
Feed the model both the rendered chart image and a pre-computed feature block (RSI, MACD, ADX, ATR, S/R levels). Let the VLM integrate — rather than extract. Avoids asking the language-first architecture to do the geometric work; lets it do the reasoning over features instead. Effort: ~1–2 engineer-weeks on top of an existing text expert. Low marginal cost if you already have the numbers.
If you believe our audit's n=37 is too small — valid concern — the right next step is a 3-month shadow-mode run at N > 1000 on live production candidates, measuring against realized outcome. Our audit would not have produced a "yes ship" regardless, but a longer run could surface cells and configurations we missed. Effort: infrastructure only; no new ML work.
Our LINK fixture was mislabeled. Models disagreed with our fixture label and (probably) with us. For a serious pattern-labeling benchmark, fixtures should be analyst-labeled with multi-rater inter-annotator agreement tracked. Chart patterns are contested even among humans. Effort: ~2 engineer-weeks plus analyst time. Low-glamour, high-correctness.
Four tight claims, every one of which the evidence above directly supports:
- As of April 2026, no frontier vision LLM we tested is capable of reliable directional chart-pattern analysis. 4 models, 2 vendors, 3 price tiers, all 95% CIs contain 50%, all confidence correlations straddle zero, all long/short gaps fail our balanced-bias production gate. Pattern-name accuracy across the entire audit: 1 correct out of 215 calls.
- QuantAgent's headline claim is structurally unsupported by the rigor of the paper: no ablation, no significance, unreleased scoring code, a 10-sample case study marketed as generalization, a decision layer prompted to deprioritize the component people cite the paper for.
- "LLM reads candlestick → predicts direction" is not a viable architecture today, and the 2024–25 VLM architecture literature suggests it may not be the right tool ever without domain-specialized decoders.
- Our reconsideration bar for future revisit: direction accuracy with Wilson 95% lower bound > 50%, signed r ≥ 0.3 with CI excluding zero, long/short gap under 10pp on balanced fixtures. No tested model cleared a single one of those thresholds.
Until a tested model clears all three, PatternExpert stays deferred.
| Model | Vendor | Tier | Route | Calls total | Parse-valid | Mean cost/call | Mean latency |
|---|---|---|---|---|---|---|---|
| claude-sonnet-4-6 | Anthropic | mid | Foundry | 5 | 5/5 | $0.01404 | 13.6 s |
| claude-opus-4-7 | Anthropic | premium | Foundry | 40 | 37/40 | $0.00898 | 10.9 s |
| claude-haiku-4.5 | Anthropic | cheap | OpenRouter | 85 | 82/85 | $0.00526–0.00637 | 5.5–6.3 s |
| google/gemini-3-flash-preview | cheap | OpenRouter | 85 | 82/85 | $0.00239–0.00307 | 3.2–4.0 s | |
| Total | 2 vendors | 3 tiers | — | 215 | 206 | — | — |
| Model | Breadth (n=5) | Depth (n=10 × 4 TFs) | n=40 4h+1d | n=40 Opus 4.7 | Total correct |
|---|---|---|---|---|---|
| claude-sonnet-4-6 | 1 / 5 (BTC V-reversal) | — | — | — | 1 |
| claude-opus-4-7 | — | — | — | 0 / 40 | 0 |
| claude-haiku-4.5 | 0 / 5 | 0 / 40 | 0 / 40 | — | 0 |
| google/gemini-3-flash-preview | 0 / 5 | 0 / 40 | 0 / 40 | — | 0 |
| Total | 1 / 15 | 0 / 80 | 0 / 80 | 0 / 40 | 1 / 215 |
| Config | Gemini 3 Flash | Haiku 4.5 |
|---|---|---|
| 4h-only | 6 / 10 (60%) | 4 / 10 (40%) |
| 1d-only | 6 / 10 (60%) | 4 / 10 (40%) |
| 1w-only | 5 / 10 (50%) | 5 / 10 (50%) |
| 4h+1d stacked | 8 / 10 (80%) | 4 / 10 (40%) |
Only Gemini 4h+1d breaks cleanly above 50% — the cell that did not survive n=40.
| Metric | Haiku 4.5 | Gemini 3 Flash | Opus 4.7 |
|---|---|---|---|
| Parsed calls | 37 / 40 | 37 / 40 | 35 / 40 |
| Direction hits | 19 | 19 | 20 |
| Accuracy | 51.4% | 51.4% | 57.1% |
| Wilson 95% CI | [35.9%, 66.6%] | [35.9%, 66.6%] | [40.9%, 72.0%] |
| Pattern-name hits | 0 | 0 | 0 |
| Signed r (conf × winner) | −0.086 | +0.053 | −0.030 |
| r 95% CI | [−0.399, +0.244] | [−0.276, +0.371] | [−0.360, +0.306] |
| Long-fixture accuracy | 10 / 17 (58.8%) | 17 / 17 (100%) | 14 / 17 (82.4%) |
| Short-fixture accuracy | 9 / 20 (45.0%) | 2 / 20 (10.0%) | 6 / 18 (33.3%) |
| Long/short gap (pp) | 13.8 | 90.0 | 49.1 |
| Mean cost / call | $0.00637 | $0.00239 | $0.00898 |
| Mean latency | 5.8 s | 3.6 s | 10.9 s |
| Total cost for round | $0.23 | $0.12 | $0.33 |
Filter: keep only calls where dirMatch = true AND confidence ≥ t. Rate = wins / kept.
| Threshold t | Haiku 4.5 kept / wins / rate | Gemini 3 Flash kept / wins / rate |
|---|---|---|
| 0.4 | 19 / 9 / 47.4% | 19 / 10 / 52.6% |
| 0.5 | 16 / 7 / 43.8% | 19 / 10 / 52.6% |
| 0.6 | 4 / 3 / 75.0% | 18 / 10 / 55.6% |
| 0.7 | 0 / 0 / n/a | 5 / 5 / 100.0% |
Every Gemini kept sample at t ≥ 0.7 was from long fixtures — which Gemini calls with 100% bullish skew. The 5/5 rate at t ≥ 0.7 is the long-bias, not calibration. Baseline winner rate = 20/40 = 50%.
| Model | Long acc | Short acc | Gap (pp) | Verdict vs. 10pp production gate |
|---|---|---|---|---|
| Claude Haiku 4.5 | 58.8% | 45.0% | 13.8 | fail (just over) |
| Claude Opus 4.7 | 82.4% | 33.3% | 49.1 | fail (severe) |
| Gemini 3 Flash Preview | 100.0% | 10.0% | 90.0 | fail (catastrophic) |
| Claude Sonnet 4.6 | 3 / 4 long = 75% | 0 / 1 short = 0% | — (n=5, noisy) | n/a — breadth only |
The production gate is 10pp. Every model audited at n=40 failed it. Two failed it by a multiple.
You are the Pattern Expert — a visual chart-pattern recognition agent in a
multi-expert crypto signal pipeline. You receive candlestick charts and emit a
structured pattern assessment that the downstream Analyst expert uses as a soft
prior when deciding trade direction.

<your_task>
  For each <pattern_request>, examine the provided chart image(s) and identify
  whether any of the 16 classical candlestick patterns listed in
  <pattern_glossary> are present.

  The primary chart (Chart A) is the short-horizon timeframe and drives pattern
  naming. The macro chart (Chart B), when provided, is only for checking
  alignment — do NOT name a separate pattern on Chart B. Only report whether
  the Chart A pattern is supported, contradicted, or neither by Chart B's
  structure via the macroAlignment field.

  If only one chart is provided, set macroAlignment to "n/a" and skip macroNote
  content reasoning.
</your_task>

<pattern_glossary>
  Please refer to the following classic candlestick patterns:

  1. Inverse Head and Shoulders — Three lows with the middle one being the
     lowest, symmetrical structure, typically indicates an upcoming upward trend.
  2. Double Bottom — Two similar low points with a rebound in between, forming
     a 'W' shape.
  3. Rounded Bottom — Gradual price decline followed by a gradual rise, forming
     a 'U' shape.
  4. Hidden Base — Horizontal consolidation followed by a sudden upward
     breakout.
  5. Falling Wedge — Price narrows downward, usually breaks out upward.
  6. Rising Wedge — Price rises slowly but converges, often breaks down.
  7. Ascending Triangle — Rising support line with a flat resistance on top,
     breakout often occurs upward.
  8. Descending Triangle — Falling resistance line with flat support at the
     bottom, typically breaks down.
  9. Bullish Flag — After a sharp rise, price consolidates downward briefly
     before continuing upward.
  10. Bearish Flag — After a sharp drop, price consolidates upward briefly
      before continuing downward.
  11. Rectangle — Price fluctuates between horizontal support and resistance.
  12. Island Reversal — Two price gaps in opposite directions forming an
      isolated price island.
  13. V-shaped Reversal — Sharp decline followed by sharp recovery, or vice
      versa.
  14. Rounded Top / Rounded Bottom — Gradual peaking or bottoming, forming an
      arc-shaped pattern.
  15. Expanding Triangle — Highs and lows increasingly wider, indicating
      volatile swings.
  16. Symmetrical Triangle — Highs and lows converge toward the apex, usually
      followed by a breakout.

  Use the names above verbatim in the "name" field of each pattern entry. Each
  pattern also carries a direction: "long" | "short" | "neutral".
</pattern_glossary>

<output_schema>
  Return valid JSON only. No prose, markdown, or commentary outside the JSON
  object. The schema is:

  {
    "chartsAnalyzed": ["4h", "1d"],
    "patterns": [
      {
        "name": "Bullish Flag",
        "timeframe": "4h",
        "direction": "long",
        "confidence": 0.72,
        "structure": "Short prose describing the shape you see and the candles
                      that form it.",
        "keyLevel": 0.1625,
        "invalidatedBelow": 0.1580
      }
    ],
    "macroAlignment": "aligned",
    "macroNote": "One sentence on how Chart B supports or contradicts the Chart
                  A pattern.",
    "dominantBias": "bullish",
    "overallConfidence": 0.68,
    "notes": "Any caveats, proximity warnings, or reasons you trimmed confidence."
  }

  Field rules:
  - chartsAnalyzed: echo only the timeframes you actually saw.
  - patterns[].timeframe: which chart the pattern is on.
  - patterns[].direction: "long" | "short" | "neutral".
  - patterns[].invalidatedBelow required for long; invalidatedAbove for short.
  - macroAlignment: one of "aligned" | "contradicting" | "neutral" | "n/a".
  - dominantBias: "bullish" | "bearish" | "neutral".
  - overallConfidence: 0.0–1.0.
  - If no pattern meets the confidence floor, return patterns: [],
    dominantBias: "neutral", overallConfidence < 0.3.
</output_schema>

<confidence_discipline>
  - confidence < 0.4  → do not name the pattern; mention the shape in notes only.
  - 0.4 ≤ c < 0.6     → report with a caveat; dominantBias may stay "neutral".
  - c ≥ 0.6           → report with commitment; dominantBias should match
                         pattern direction.
  - c ≥ 0.8           → reserved for a textbook-clean pattern with confirming
                         structure AND aligned macro. Do not reach this tier on
                         ambiguous shapes.
</confidence_discipline>

<non_negotiables>
  - Never invent prices. Every keyLevel, invalidatedBelow, and invalidatedAbove
    must correspond to a visible candle extreme or a level supplied in
    chart_a_overlays / chart_b_overlays.
  - Never trade on pattern alone. Your output is a soft prior that Analyst and
    Composer consume alongside flow and regime signals. You do not issue
    directives.
  - Honest abstain: if the chart is noisy, choppy, or range-bound with no
    recognizable shape, return patterns: [] with overallConfidence < 0.3 and
    an honest one-sentence note. Abstaining is expected and valued behavior —
    false positives are more costly than silence.
</non_negotiables>
Plus two verbatim few-shot examples — a textbook Bullish Flag with aligned daily macro, and an abstain-on-chop case. Omitted here for length. The full rendering mirrors what shipped to every model.
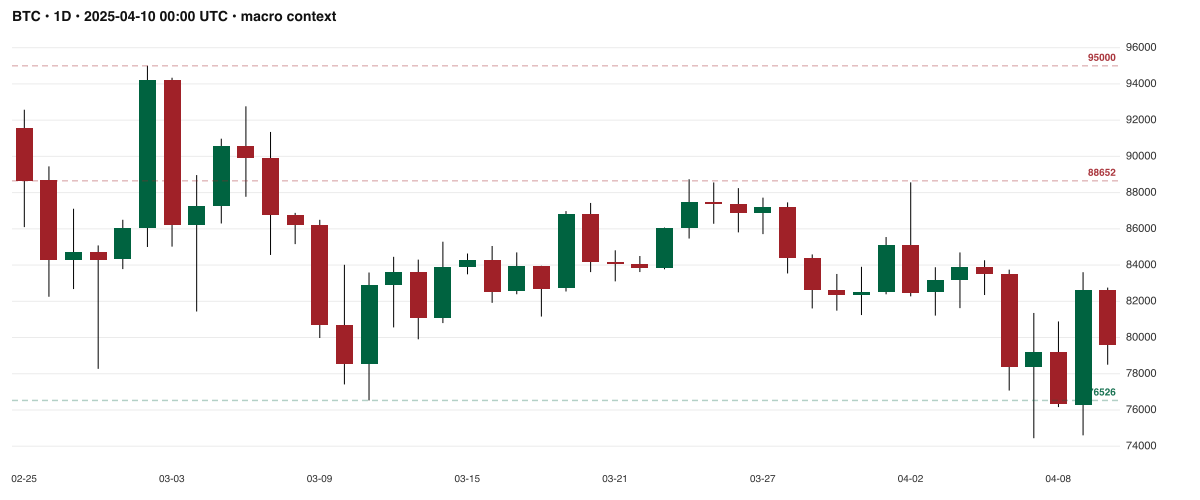
Rendered deterministically via node-canvas. No editing, no upscaling, no re-encoding. These are the exact PNGs shipped to each vision LLM during the audit.
BTC · 4H · April 7, 2025 tariff flush — the one case Claude Sonnet 4.6 named correctly ("V-shaped Reversal") across 215 calls. The structure is unambiguous by any human standard.
BTC · 1D · macro context chart sent alongside the 4H primary in the paired config.
LINK · 4H — labeled "Ascending Triangle / long" by our fixture generator, but visually a clear descending channel with lower highs. Every model that weighed in independently called it bearish. This fixture error was corrected in the n=40 re-test and highlights the risk of agent-labeled ground truth.
DOGE · 4H — typical 4H consolidation. Gemini 3 Flash called "Falling Wedge/long" (confidence 0.48). Claude Haiku 4.5 called "Rectangle/neutral". Gemini 3 Flash on the paired 4H+1D config flipped to "Descending Triangle/short". All three models, same chart, three different patterns, two different directions.
All four charts are hosted in the public roman-rr/trading-skills repository with a companion README.
4 models. 2 vendors. 3 price tiers. 215 LLM calls. $1.16 spent.
- 1 correct pattern name out of 215.
- Direction accuracy 51% at n=37 on both cheap-tier models; 57% on premium-tier Opus 4.7. All Wilson 95% CIs contain 50%.
- Signed confidence–correctness correlation near zero with CI through zero for all three audited models.
- Gemini 3 Flash: 100% long-bias on longs, 10% on shorts, 90pp gap.
- Opus 4.7: 49pp gap at 2.8× the cost.
We rejected our planned PatternExpert on this evidence. We publish so you can skip the same expensive realization.
This audit was conducted April 2026 on 40 verified production crypto signals plus a 5-fixture breadth pass with curated known-pattern charts. All numerical claims trace to matrix JSON files and the QuantAgent paper (arXiv:2509.09995v3). All conclusions are bounded by the test scope documented in §12.