
-
-
Save tacaswell/3144287 to your computer and use it in GitHub Desktop.
| import matplotlib.pyplot as plt | |
| def zoom_factory(ax,base_scale = 2.): | |
| def zoom_fun(event): | |
| # get the current x and y limits | |
| cur_xlim = ax.get_xlim() | |
| cur_ylim = ax.get_ylim() | |
| # set the range | |
| cur_xrange = (cur_xlim[1] - cur_xlim[0])*.5 | |
| cur_yrange = (cur_ylim[1] - cur_ylim[0])*.5 | |
| xdata = event.xdata # get event x location | |
| ydata = event.ydata # get event y location | |
| if event.button == 'up': | |
| # deal with zoom in | |
| scale_factor = 1/base_scale | |
| elif event.button == 'down': | |
| # deal with zoom out | |
| scale_factor = base_scale | |
| else: | |
| # deal with something that should never happen | |
| scale_factor = 1 | |
| print event.button | |
| # set new limits | |
| ax.set_xlim([xdata - cur_xrange*scale_factor, | |
| xdata + cur_xrange*scale_factor]) | |
| ax.set_ylim([ydata - cur_yrange*scale_factor, | |
| ydata + cur_yrange*scale_factor]) | |
| ax.figure.canvas.draw_idle() # force re-draw the next time the GUI refreshes | |
| fig = ax.get_figure() # get the figure of interest | |
| # attach the call back | |
| fig.canvas.mpl_connect('scroll_event',zoom_fun) | |
| #return the function | |
| return zoom_fun |


There is another way of doing it as far as I know. By chance I came across the Axis.zoom method. I don't know if this is faster or a good way in general, but it works and is certainly less code:
    def zoom(self, event):
        if event.inaxes == self.ax:
            scale_factor = np.power(self.zoom_factor, -event.step)*event.step
            self.ax.get_xaxis().zoom(scale_factor)
            self.ax.get_yaxis().zoom(scale_factor)
            self.ax.invert_yaxis()
            self.canvas.draw_idle()
If you plot an image though, for some reason, you have to invert the y-axis again.

If you're using this in an environment with a toolbar and you want the home button to return to the original view after zooming:

then I found that you need to force the initial position to be pushed into the toolbars _nav_stack. When using the ipympl backend I did this using like so:
fig.canvas.toolbar.push_current()
zoom_factory(ax)
you could also add this to the zoom factory, but that may be risky as I'm not sure that fig.canvas.toolbaris guaranteed to exist.
Edit:
I just peeked around the forks of this gist and what I described with the toolbar was implemented in this one: https://gist.github.com/scott-vsi/522e756d636557ae8f1ef3cdb069cecd
that gist also does some nice checking inside of zoom_fun to also set the _nav_stack there if there are no views already pushed:
        toolbar = ax.get_figure().canvas.toolbar # only set the home state
        if toolbar._views.empty():
            toolbar.push_current()
@ianhi Can you please post an example code in which we zoom a plot. I'm a beginner with matplotlib and can't get to work the function right. Thanks!

This may help.
You do the plot, call zoom_factory, then show the plot:
fig = `plt.figure(...
graph = fig.add_subplot(111)
graph.plot(...
zf = zoom_factory(graph)
plt.show()
I've been using it quite happily but my code is a bit too specific but derived from simp_zoom.py

@mapfiable Interesting, I also did not know that existing until you pointed it out! The reason for the re-inversion is that you can invert the axis by setting the "min" to be greater than the "max" and inside of axis.zoom (which calls Locator.zoom) the inversion is discarded.
@tacaswell: do you think it is a good alternative? There is also Axis.pan, but I didn't manage to make it work properly.

Can we implement this code in jupyter Notebook?
If yes, please explain.
Yes, but you must use either %matplotlib notebook or %matplotlib widget which should "just work". If you are using %matplotlib inline it will not work (because that is not an interactive backend).
There's a small caveat to "just working" in the notebook - the widget backend doesn't have an option capture scroll events so you will end up scrolling the entire notebook while also zooming:
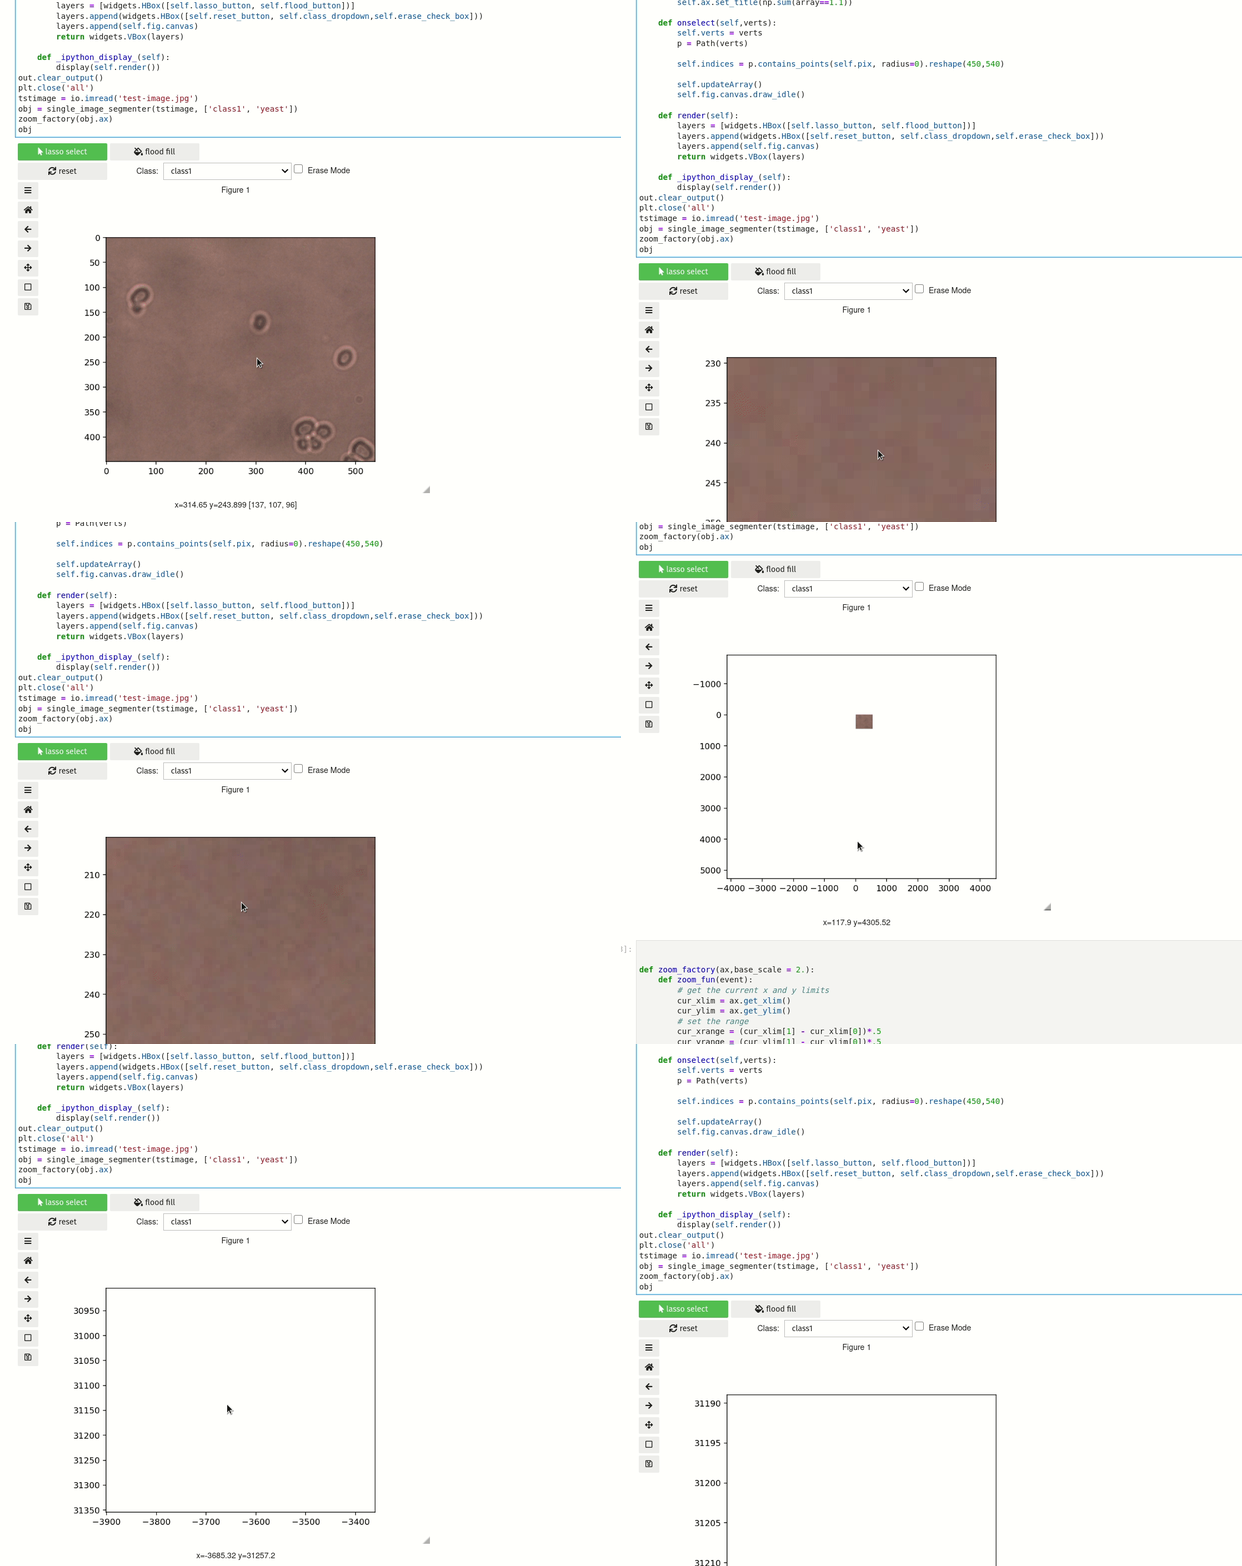
The workaround I used for this was to to use jupyterlab sidecar widget to display the plot as that won't have a scroll bar so it doesn't matter that the scroll input wasn't captured. Long term - I opened an issue and PR about this matplotlib/ipympl#222 that I think would fix this.
Also I think you will need to install the widget backend (https://github.com/matplotlib/ipympl#installation) as that isn't included with standard matplotlib
That is a fun bug! I left a review on your PR at ipympl.
Thanks!
For completeness for any future readers: The fix for scrolling in the notebook was merged and should be part of any release of ipympl after 0.5.6 (it is not in that release)

Hey, I tried to implement this in a wxPython Frame, but I keep getting a TypeError: zoom_fun() missing 1 required positional argument: 'event'. I know how to solve missing events in wxPython, but not in matplotlib. It should work because otherwise I wouldn't be getting the error on scrolling...
Edit: Turns out there is a work around, that only works if you're also pressing down the mouse wheel, not just scrolling with it...
@peroman200 Interesting, can you still reproduce that issue in mpl3.4?

License for your code?
Thanks

Note that this is implemented directly (using Control+scroll) in Matplotlib as of 3.11: matplotlib/matplotlib#30405
Thank you guys! I've found beneficial to implement 'event.step'. Posting the code.
Implementation of @giadang (commented on Jan 17, 2015) with event.step:
My own implementation into Qt from mine project (stripped a bit) - shift selects the axis and also mods functionality: