
Last active
July 23, 2022 21:13
-
-
Save zjuul/48bb7abcfb7cae5bc719e311630110a6 to your computer and use it in GitHub Desktop.
This file contains hidden or bidirectional Unicode text that may be interpreted or compiled differently than what appears below. To review, open the file in an editor that reveals hidden Unicode characters.
Learn more about bidirectional Unicode characters
| library(httr) | |
| library(jsonlite) | |
| library(lubridate) | |
| library(tidyverse) | |
| ########### config | |
| # | |
| # my info - replace this with your enphase api key, app id, user_id | |
| api_key <- '80b9...9f87' | |
| auth_url <- 'https://enlighten.enphaseenergy.com/app_user_auth/new?app_id=140...001' | |
| user_id <- '4d...0a' | |
| # enphase info: api url v2 | |
| api_url <- 'https://api.enphaseenergy.com/api/v2/systems' | |
| # set from and to dates (365 days default, you can hardcode dates, too) | |
| from_date <- format.Date(as.POSIXct(Sys.Date()-365), '%Y-%m-%d') | |
| to_date <- format.Date(as.POSIXct(Sys.Date()), '%Y-%m-%d') | |
| ################### | |
| # get the response, containing the system ID, and extract it | |
| response <- GET(paste0( | |
| api_url,'?key=',api_key,'&user_id=',user_id | |
| )) | |
| json_r <- fromJSON( content(response, as = "text") ) | |
| system_id <- json_r[[1]]$system_id[1] | |
| # now, get the lifetime usage info, to find all day totals | |
| energy_lifetime <- GET(paste0( | |
| api_url, '/', system_id, | |
| '/energy_lifetime?start_date=', from_date, | |
| '&end_date=', to_date, | |
| '&key=',api_key,'&user_id=',user_id | |
| )) | |
| elr <- fromJSON( content(energy_lifetime, as = "text") ) | |
| # grab the first date and last date available, make a list | |
| first_day <- format.Date( as.POSIXct( elr$start_date ), '%Y-%m-%d') | |
| last_day <- format.Date( as.POSIXct( elr$meta$last_report_at, origin="1970-01-01" ), '%Y-%m-%d') | |
| date_list <- seq(as.Date(first_day), as.Date(last_day), by = "day") | |
| # loop over the list of dates, with 7 second pause to prevent throttling | |
| all_stats_single <- date_list[1:364] %>% | |
| map_dfr( | |
| .f = function(d) { | |
| start <- as.numeric(as.POSIXct( d )) | |
| end <- start + 24 * 3600 -1 | |
| stats <- GET(paste0( | |
| api_url, '/', system_id, | |
| '/stats?start_at=', start, | |
| '&end_at=', end, | |
| '&key=',api_key,'&user_id=',user_id | |
| )) | |
| allstats <- fromJSON( content(stats, as = "text") ) | |
| if(stats$status_code == 200 & class(allstats$intervals) == "data.frame") { | |
| message(d) | |
| ret <- allstats$intervals %>% mutate( date_string = d ) | |
| } else { | |
| message(stats$status_code) | |
| message(class(allstats$intervals)) | |
| ret <- NULL | |
| } | |
| Sys.sleep(7) | |
| ret | |
| } | |
| ) | |
| # done! | |
| # now, since historic data does not change, no need to fetch it again, we store it: | |
| write_csv(all_stats_single, "./panel_history.csv") | |
| # Now reformat the pulled data for plotting, and make the plot | |
| history <- all_stats_single %>% | |
| mutate( | |
| ts = as.POSIXct( end_at, origin="1970-01-01" ), | |
| day = wday(ts, label = TRUE, abbr = FALSE), | |
| week = paste(year(ts), 'week', str_pad(week(ts), 2, side = "left", pad = "0")), | |
| month = month(ts), | |
| actualday = as.Date(as.character(ts)), | |
| intraday = hour(ts) * 60 + minute(ts) | |
| ) %>% | |
| group_by(actualday) %>% mutate(`Daily kWh` = sum(enwh)/1000) %>% | |
| ungroup() | |
| ggplot(history, | |
| aes(x = intraday, y = enwh)) + | |
| geom_line(aes(color = `Daily kWh`, group = actualday), size = 1, alpha = .7) + | |
| theme_void() + | |
| scale_color_viridis_c(option = "magma") + | |
| facet_wrap(. ~ week, nrow=6, strip.position="bottom") + | |
| theme(plot.margin=unit(c(1,1,1.5,1.2),"cm"), legend.position = "left") + | |
| theme(plot.title = element_text(margin=margin(0,0,30,0))) + | |
| theme(plot.background = element_rect(fill = "lightgrey")) + | |
| ggtitle(" Solar panel power production during the day") | |

Author
Author
history df (plot data)

Author
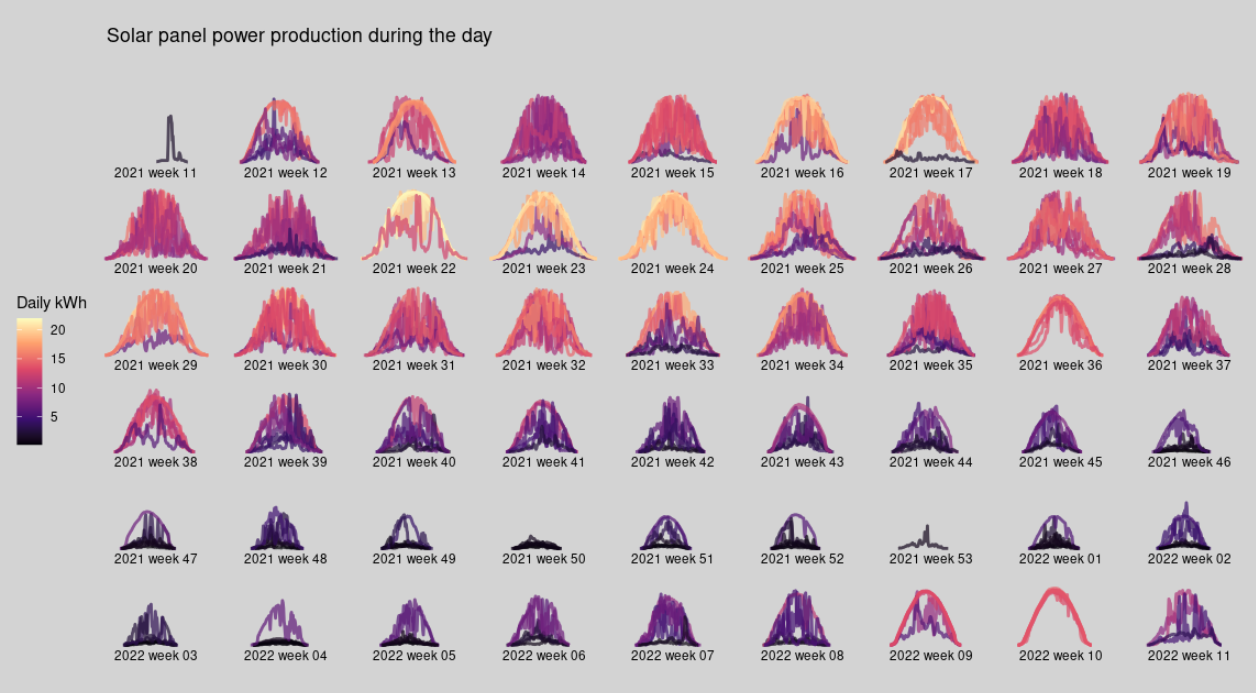
The plot
Sign up for free
to join this conversation on GitHub.
Already have an account?
Sign in to comment
all_stats_single df (pulled data)